| The Energy and Environment Round-Up: November 6th 2007 | The Oil Drum: Canada | Energy Decline and National GDP in 2050: The Growth of Destitution |
World Energy to 2050: A Half Century of Decline
Posted by Stoneleigh on November 10, 2007 - 10:30am in The Oil Drum: Canada
This is Part 1 of a guest post by GliderGuider. Paul's website can be found here.
This article supercedes an earlier work, "World Energy and Population: Trends to 2100". Compared to that paper this article offers a more comprehensive look at the world's evolving energy picture and confines its projections to the first half of the century. Also unlike that earlier work, this article makes no assumptions about changes in human population due directly to reductions in the world's energy supply. At the end of the article I will briefly examine one highly probable effect the decline in total energy would have on the quality of human life.
Introduction
Throughout history, the expansion of human civilization has been supported by a steady growth in our use of high-quality exosomatic energy. This growth has been driven by our increasing population and our increasing level of activity. As we learned to harness the energy sources around us we progressed from horse-drawn plows, hand forges and wood fires to our present level of mechanization with its wide variety of high-density energy sources. As industrialization has progressed around the world, the amount of energy each one of us uses has also increased, with the global average per capita consumption of all forms of energy rising by 50% in the last 40 years alone.
This rosy vision of continuous growth has recently been challenged by the theory of "Peak Oil", which concludes that the amount of oil and natural gas being extracted from the earth will shortly start an irreversible decline. As that decline progresses we will have to depend increasingly on other energy sources to power our civilization. In this article I will offer a glimpse into that changed energy future. I hope to be able to provide a realistic assessment of the evolution of the global energy supply picture, and to estimate how much of the various types of energy we will have available to us in the coming decades.
Methodology
The analysis in this article is supported by a model of trends in energy production. The model is based on historical data of actual energy production, connected to projections drawn from the thinking of various expert energy analysts as well as my own interpretation of future directions and some purely mathematical projections.
The current global energy mix consists of oil (36%), natural gas (24%), coal (28%), nuclear (6%), hydro (6%) and renewable energy such as biomass, wind and solar (about 2%). Historical production in each category (except for renewable energy) has been taken from the BP Statistical Review of World Energy 2007. In order to permit comparison between categories I use a standard measure called the tonne of oil equivalent (toe). Using this measure, well-known conversion factors for thermal and electrical energy production permit the different energy sources to be easily compared.
We will first examine the energy sources separately, applying the development parameters that seem most appropriate to each. For each source I will define as clearly as possible the factors I have considered in building its scenario. This transparency will allow you to decide for yourself whether my assumptions seem plausible. We will then combine the individual energy analyses into a single global energy projection.
Notes
The model was developed as a simple Excel spreadsheet. The timing of some significant energy-related events and rates of increase or decrease of supply were chosen through careful study of the available literature. In some cases different authors had diverging opinions on these matters. To resolve those situations I have relied on my own analysis and judgment. As a result the model has remained open to the influence of my personal biases. I make no apology for this potential subjectivity; such scenarios always reflect the opinions of their authors, and it is best to be clear about that from the start. Nevertheless, I have made deliberate efforts throughout to be objective in my choices, to base my projections on observed trends in the present and recent past, and to refrain from wishful thinking at all times.
This article will not present any prescriptive measures. The analysis is intended solely to clarify a "most likely" future scenario, based purely on the situation as it now exists and will probably unfold. You will not find any specific suggestions for what we ought to do, or any proposals based on the assumption that we can radically alter the behaviour of people or institutions over the short term. While the probability of such changes will increase if the global situation shifts dramatically, such considerations would introduce a level of uncertainty into the analysis that would make it conceptually intractable. The same constraint holds true for new technologies. You will not find any discussion of fusion or hydrogen power, for example.
The Excel spreadsheet containing the data used in this model is available here.
Our Energy Sources
Oil
The analysis of our oil supply starts from the recognition that it is finite, non-renewable, and subject to effects which will result in a declining production rate in the near future. This situation is popularly known as Peak Oil. The key concept of Peak Oil is that after we have extracted about half the total amount of oil in place the rate of extraction will reach a peak and then begin an irreversible decline.
This peak and decline happens both for individual oil fields and for larger regions like countries, but for different reasons. In individual oil fields the phenomenon is caused by geological factors inherent to the structure of the oil reservoir. At the national or global level it is caused by logistical factors. When we start producing oil from a region, we usually find and develop the biggest, most accessible oil fields first. As they go into decline and we try to replace the lost production, the available new fields tend to be smaller with lower production rates that don't compensate for the decline of the large fields they are replacing.
Oil fields follow a size distribution consisting of a very few large fields and a great many smaller ones. This distribution is illustrated by the fact that 60% of the world's oil supply is extracted from only 1% of the world's active oil fields. As one of these very large fields plays out it can require the development of hundreds of small fields to replace its production.
The theory behind Peak Oil is widely available on the Internet, and some introductory references are given here, here and here. In addition, the German organization Energy Watch Group provides an exceptionally comprehensive (but still accessible) overview of the topic in the Executive Summary of their recently released study of Peak Oil.
Timing
There is much debate over when we should expect global oil production to peak and what the subsequent rate of decline might be. While the rate of decline is still hotly contested, the timing of the peak has become less controversial. Recently a number of very well informed people have declared that the peak has arrived. This brave band includes such people as billionaire investor T.
Boone Pickens, energy investment banker Matthew Simmons (author of the book "Twilight in the Desert" that deconstructs the state of the Saudi Arabian oil reserves), retired geologist Ken Deffeyes (a colleague of Peak Oil legend M. King Hubbert) and Dr. Samsam Bakhtiari (a former senior scientist with the National Iranian Oil Company). This view is also supported by the extremely detailed analysis published by the Energy Watch Group mentioned above.
My position is in agreement with these luminaries: the peak is happening as I write these words (in late 2007). I have confirmed its occurrence to my own satisfaction by examining the pattern of oil production and oil prices over the last three years. I discovered in the process that crude oil production peaked in May 2005 and has shown no growth since then despite a doubling in price and a dramatic surge in exploration activity.
Decline Rate
The post-peak decline rate is another question. The best guides we have are the performances of oil fields and countries that are known to be already in decline. Unfortunately, those decline rates vary all over the map. The United States, for instance, has been in decline since 1970 and has lost 40% of its production capacity since then, for a decline rate of about 2% per year. On the other hand, the North Sea basin is showing an annual decline around 10%, and the giant Cantarell field in Mexico is losing production at rates approaching 20% per year.
In order to create a realistic decline model for the world's oil, I have chosen to follow the approach of the Energy Watch Group, which is similar in profile to the projections of Dr. Bakhtiari in
his WOCAP model. Both assume a gradually increasing decline rate over time, starting off very gently and ramping up as the years go by. The main difference is that the EWG model is slightly less aggressive than WOCAP. WOCAP predicts that production will fall from its current value of 4000 million tonnes of oil per year (Mtoe/yr) to 2750 Mtoe/yr in 2020, while the EWG projects a decline to 2900 Mtoe/yr by then. The EWG projects an oil supply of just under 2000 Mtoe in 2030. My model projects a decline rate increasing from 1% per year in 2010 to a constant rate of 5% per year after 2025, resulting in an average decline rate of 4% per year between now and 2050. In 2050 oil production is only 18% of what it is today, as shown in Figure 1.

Figure 1: Global Oil Production, 1965 to 2050
Keep in mind that Peak Oil is primarily a transportation fuel problem. Almost 70% of the world's oil is used in transportation as gasoline, diesel fuel, jet fuel and bunker fuel for ships. Right now there is a lot of excitement surrounding the development of electric cars. However, the immediacy of the peak and the slope of the following decline suggest that it may prove difficult to replace enough of the global automobile fleet in the time available to maintain the ubiquitous personal mobility we have become used to. Europe and Asia are placing a lot of emphasis on electrifying inter-city rail and urban mass transit. Rail electrification seems like a sensible initiative that should be pursued urgently by all nations.
Natural Gas
The supply situation with natural gas is very similar to that of oil. This similarity makes sense because oil and gas come from the same biological source and tend to be found in similar geological formations. Gas and oil wells are drilled using very similar equipment. The differences between oil and gas have everything to do with the fact that oil is a viscous liquid while natural gas is, well, a gas.
While oil and gas will both exhibit production peaks, the slope of the post-peak decline for gas will be significantly steeper due to its lower viscosity. To help understand why, imagine two identical balloons, one filled with water and the other with air. If you set them down and let go of their necks, the air-filled balloon will empty much faster than the one filled with water. Even though oil and gas reservoirs are made up of porous rock rather than being big pockets of liquid or gas, they behave in much the same way. Because of its viscosity, oil reservoirs often require their internal pressure to be raised over time by pumping in water, in order to force out the oil and maintain their flow rates. In contrast, when a gas reservoir is pierced by the well, the gas flows out rapidly under its own pressure. As the reservoir empties the flow can be kept relatively constant until the gas is gone, when the flow will suddenly stop.
Gas reservoirs show the same size distribution as oil reservoirs. As with oil, we found and drilled the big ones, in the most accessible locations, first. The reservoirs that are coming on-line now are getting progressively smaller, requiring a larger number of wells to be drilled to recover the same volume of gas. For example, the number of gas wells drilled in Canada between 1998 and 2004 went up by 400% (from 4,000 wells in 1998 to 16,000 wells in 2004), while the annual production stayed constant. These considerations mean that the natural gas supply will exhibit a similar bell-shaped curve to what we saw for oil. In fact, the production of natural gas peaked in the United States in 2001, and in Canada in 2002. In addition, the remaining large gas and oil deposits are in less and less accessible locations, making the extraction of their reserves slower and more expensive.
One other difference between oil and gas is the nature of their global export markets. Compared to oil, the gas market is quite small due to the difficulty in transporting gases compared to liquids. While oil can be simply pumped into tankers and back out again, natural gas must first be liquefied (which takes substantial energy), transported in special tankers at low temperature and high pressure, then re-gasified at the destination which requires yet more energy. As a result most of the world's natural gas is shipped by pipeline, which pretty well limits gas to national and continental markets. This constraint has an important implication: if a continent's gas supply runs low it is very difficult to supplement it with gas from somewhere else that is still well-supplied.
The peak of world gas production may not occur until 2025, but two things are sure: we will have even less warning than we had for Peak Oil, and the subsequent decline rates may be shockingly high. I have chosen 2025 as the global peak (20 years after Peak Oil). The peak is followed by a rapid increase in decline to 10% per year by 2050, for an average decline rate of 6% per year. In 2050 gas production is projected to be only 24% of its current value. The production curve for natural gas is shown in Figure 2.
Figure 2: Global Natural Gas Production, 1965 to 2050
One of the big concerns regarding a decrease in global natural gas supplies has to be about its role in the production of ammonia for fertilizer. Currently 4% of the world's natural gas is used for fertilizer production (the largest uses are as industrial and residential heat sources, and for electricity generation). As the gas supply declines the price will automatically rise and fertilizer prices will go along for the ride. Rising fertilizer prices will have dire consequences in a world whose expanding population needs to be fed, where much of the land would not be able to sustain its current production levels without artificial fertilizer, and where the largest population increases will occur in the poorest nations with the least productive soils.
It is possible to produce the hydrogen required to make ammonia (the feedstock for most fertilizer) from other sources - coal and electrolysis are often mentioned. There are substantial risks associated with those approaches, though. The cost of hydrogen from alternative sources is still considerably higher than for hydrogen made from methane, pricing any resulting fertilizer out of the reach of those who need it most. Making hydrogen from coal will also generate greenhouse gases as the carbon is burned for process heat. Electrolysis depends on having cheap sources of surplus electricity available, electricity that is not being used for higher priorities. As will become clear below, there is a strong posibility that such surpluses will never materialize, especially if the natural gas currently being used for electricity generation needs to be replaced by other sources.
Oil and Gas Combined
Oil and natural gas are the world's primary fuel sources, used for both transportation and heat. Together they supply a full 60% of the energy currently used by humanity. According to this model, their combined energy peak will come in 2012, at 6679 Mtoe. By 2050 they will be producing a combined energy of only 1386 Mtoe. This represents a drop of 80%. To the extent that we cannot replace this shortfall through novel uses of electricity from other sources, this decline represents an enormous challenge. It is a challenge that seems destined to alter the fundamental shape of our civilization over the next three or four decades.
Coal
Coal is the ugly stepsister of fossil fuels. It has a terrible environmental reputation, going back to its first widespread use in Britain in the 1700s. London's coal-fired "peasoup" fogs were notorious, and damaged the health of hundreds of thousands of people. Nowadays the concern is less about soot and ash than about the acid rain, mercury and especially carbon dioxide that results from burning coal. For the same amount of energy released, coal produces more CO2 than either oil or gas. From an energy production standpoint coal has the advantage of very great abundance. Of course that very abundance is a huge negative when considered from the perspective of global warming.
Most coal today is used to generate electricity. As economies grow, so does their demand for electricity. The need to use electricity to replace some of the energy lost due to the decline of oil and natural gas will put yet more upward pressure on the demand for coal. At the moment China is installing two to three new coal-fired power plants per week, and has plans to continue at that pace for at least the next decade.
Just as we saw with oil and gas, coal will exhibit an energy peak and decline, though for different reasons. One important factor in the eventual decline of the energy obtained from burning coal is that we have in the past concentrated on finding and using the highest grade of coal: anthracite. Much of what remains consists of lower grade bituminous and lignite. These grades of coal produce less energy when burned, and require the mining of ever more coal to get the same amount of energy.
In addition to their exemplary study of oil supplies mentioned above, the Energy Watch Group has also conducted an extensive analysis of coal use over the next century. I have adopted their "best case" conclusions for this model. The model projects a continued rise in the use of coal to a peak in 2025. As global warming begins to have serious effects there will be mounting pressure to reduce coal use. Unfortunately, due to its abundance and our need to replace some of the energy lost from the depletion of oil and gas, the decline in coal use will not be as dramatic as seen with those fossil fuels. The model has coal use decreasing evenly from its peak to a production level similar to what it is today, giving the curve shown in Figure 3.
Figure 3: Global Coal Production, 1965 to 2050
Of course the increased use of coal carries with it the threat of increased global warming due to the continued production of CO2. Many hopeful words have been written about the possibility of alleviating that worry by implementing Carbon Capture and Storage. CCS usually involves the capture and compression of CO2 from power plant exhaust, which is then pumped into played-out gas fields for long term storage. This technology is still in the experimental stage, and there is much skepticism surrounding the security and economics of storing such enormous quantities of CO2 in porous rock strata.
Hydro
If coal is the ugly stepsister, hydro is one of the fairy godmothers of the energy story. Environmentally speaking it's relatively clean, if perhaps not quite as clean as once thought. It has the ability to supply large amounts of electricity quite consistently. The technology is well understood, universally available and not too technically demanding (at least compared to nuclear power). Dams and generators last a long time.
It has its share of problems, though they tend to be quite localized. Destruction of habitat due to flooding, the release of CO2 and methane from flooded vegetation, and the disruption of river flows are the primary issues. In terms of further development the main obstacle is that in many places the best hydro sites are already being used. Nevertheless, it is an attractive energy source.
Figure 4: Global Hydro Production, 1965 to 2050
Development will probably continue in the immediate future at a similar pace as in the past. The model for hydro power has its capacity increasing by almost 40% by 2050. This projected growth is gradually constrained toward the middle of the century by two main factors: most useful river sites are already in use, and water flows will gradually be reduced due to global warming. There may also be a general loss of global industrial capacity (and/or rising development costs) due to oil and gas depletion. Nevertheless, the pressure on hydro power to replace energy lost from oil and gas depletion will support continued development even in the face of such constraint.
Nuclear
The graph in Figure 5 is a mix of data synthesis with a bit of projection. I started with a table of reactor ages from the IAEA (reprinted in a presentation to the Association for the Study of Peak Oil and Gas), the table of historical nuclear power production from the BP Statistical Review of World Energy 2007 and a table from the Uranium Information Centre showing the number of reactors that are installed, under construction, planned or proposed worldwide.
The interesting thing about the table of reactor ages is that it shows the vast majority of the world's operating reactors (361 out of 439 or 82% to be precise) are between 17 and 40 years old. The number of reactors at each age varies of course, but the average number of reactors in each year is about 17. The number actually goes over 30 in a couple of years.
Two realizations formed the basis for my model of nuclear power. The first was that reactors have a finite lifespan averaging around 40 years, which means that a lot of the world's reactors are rapidly approaching the end of their useful life. The second realization was that the construction rate of new reactors and their average capacity can be inferred from the UIC planning table. We can therefore calculate the approximate world generating capacity with reasonable accuracy out to 2030 or so.
The model takes a generous interpretation of the available data. It assumes we will build all the reactors shown in the UIC data referenced above: six plants per year for the next five years, nine plants per year for the subsequent ten years, and ten plants per year until 2050. The model further assumes that all reactors will be granted life extensions to 50 years from their current 40, and that no plants will be prematurely decommissioned. It also assumes that each plant generates an average output equivalent to 1.53 Mtoe per year. The derivation of this figure is given in the model data available here.
Figure 5: Global Nuclear Production, 1965 to 2100
The drop in output between 2020 and 2037 is the result of new construction not keeping pace with the decommissioning of old reactors. The argument for a peak and subsequent decline in nuclear capacity is very similar to the logistical considerations behind Peak Oil - the big pool of reactors we currently use will start to become exhausted, and we're not building quite enough replacements. The rise after 2037 comes from my estimate that we will then be building 10 reactors per year compared to 6 per year today. The net outcome is that in 2050 nuclear power will be supplying about the same amount of energy that it is today.
A number of factors may act to increase that output. Those changes could include the uprating of existing reactors to produce more power than their original design specification, an increase in the size of future reactors and/or a building boom prompted by concerns about global warming and the decline of oil and gas supplies.
Restraining the increase will be economic factors (construction will become more expensive as oil and gas deplete, driving up the cost of materials and transportation), and continuing public opposition to nuclear power plants, waste storage and uranium mining. At some point uranium mining itself may also become a bottleneck - the current world production of about 50,000 tonnes of uranium per year could need to increase to around 70,000 tonnes per year in order to fuel the increased number of reactors. Of course the amount of additional uranium required will depend entirely on the number of new plants that actually get built.
A number of advanced reactor technologies are presently under investigation or development, including high energy "fast reactors" that produce less waste, reactors that can use more abundant and cheaper thorium as a fuel, and "pebble bed" designs that promise improved safety. None of these technologies are commercially available (and are unlikely to be within the next decade or two), so they have not been incorporated into the model.
Renewable Energy
Renewable energy includes such sources as wind, photovoltaic and thermal solar, tidal and wave power, biomass etc. Assessing their probable contributions to the future energy mix is one of the more difficult balancing acts encountered in the construction of the model. The whole renewable energy industry is still in its infancy. At the moment, therefore, it shows little impact but enormous promise. While the global contribution is still minor (at the moment non-hydro renewable technologies supply about 1% of the world's total energy needs) its growth rate is exceptional. Wind power, for example, has experienced annual growth rates of 30% over the last decade, and solar power is doing about as well, though from a lower starting point.
Proponents of renewable energy point to the enormous amount of research being conducted and to the wide range of approaches being explored. They also point out correctly that the incentive is enormous: the development of renewable alternatives is crucial for the sustainability of human civilization. All this awareness, work, and promise give the nascent industry an aura of strength verging on invincibility, which in turn supports a conviction among its promoters that all things are possible.
Of course, the real world is full of unexpected constraints and unwarranted optimism. One such constraint has shown up in the field of biofuels, where a realization of the conflict between food and fuel has recently broken through into public consciousness. One can also see excessive public optimism at work in the same field, where dreams of replacing the world's gasoline with ethanol and biodiesel are now struggling against the limits of low net energy in biological processes.
The key questions in developing a believable model are, what is the probable growth rate of renewable energy over the next 50 years, and what amount of energy will it ultimately contribute? I do not subscribe to the pessimistic notion that renewables will make little significant contribution. However, I think it's equally unrealistic to expect that they will achieve a dominant position in the energy marketplace, due to their late start and their continuing economic disadvantage relative to coal.
In order to project realistic growth rates for renewable energy sources I have used the same mathematical approach as I used for hydro. Data on recent global production of wind, solar photovoltaic and other forms of renewable energy was used as the starting point for the projections. Excel trend lines were fitted to the data and the equations generated in the process were used to extrapolate the growth of each source. As we saw previously, the closeness of the fits as demonstrated by the R-squared values on the graphs gives a certain degree of confidence in the projections.
These projections should be treated with a great deal of caution. Because both the wind and solar power industries are still so new, it is possible that they may exhibit higher growth rates in the future, thus making the following projections too conservative. On the other hand they may run into unexpected constraints that would skew the outcome in a more pessimistic direction. Due to the youth of the industry there is very little historical production data to use in establishing the trends. This scarcity of data makes statistical projections less trustworthy, as large discontinuities in production from year to year may render the curve fits unreliable. On the other hand, there is at least some basis for the projections beyond the enthusiasm of the proponents or the gainsaying of their detractors. The projections should be regarded more as thought experiments - do they seem reasonable given your own assumptions of how the energy world works? If they seem unreasonable (either too high or too low), what is the evidence that will dispute them?
Wind
Data on the global production of wind energy from 1997 to 2005, collected by the World Wind Energy Association and reprinted in this graphic, was used as the starting point for the projection shown in Figure 6. The closeness of the fit of the calculated curve to the actual production data, as indicated by the R-squared value of .998, gives us a reasonable degree of confidence in the projection.
Figure 6: Actual and Projected Wind Power, 1997 to 2050
There are a number of factors that may act on the future development of wind power. There is no doubt that it is an attractive replacement for coal or gas-fired electricity generation, at least within the limits imposed by the inherent variability of wind power. If that limitation can be addressed, either through cheaper energy storage techniques to bridge periods of low wind or smart grids that can tolerate larger amounts of variable power, a significant constraint to rapid and extensive wind development may be removed. The other potential constraint is the ever-present threat of oil and natural gas depletion. The rising cost of oil and gas may drive the cost of industrial production of all kinds up sharply before wind power has achieved a significant presence.
As in the case of nuclear power there will be pressures to speed up the development of wind power because of global warming and the depletion of oil and gas, as well as restraining forces imposed by economics, technical feasibility and perhaps some public resistance to having turbines in their neighborhood.
All in all, with a projected growth of 2200% from now until 2050 it looks as though wind is the renewable energy source that will make the most difference to the world's energy mix over the next 50 years.
Solar Photovoltaic
The data for actual solar photovoltaic production were compiled from here, here and here. This time, a third order polynomial was used to project the historical trend based on data from 1996 to 2006, and once again the fit is good enough to give some confidence that the observed trend is real. Though the growth of solar power in percentage terms is spectacular (an increase of 12,000% by 2050), given the lower starting point the contribution of solar power in 2050 will amount to only half that of wind. However, wind and solar technologies are different enough in their application that this amount of solar
power should make a dramatic difference in the lives of many around the world.
Figure 7: Actual and Projected Solar Power, 1996 to 2050
Other Renewables
In the category of "other renewables" we have such sources as geothermal, biomass, tidal power etc. Production figures for these sources were obtained from the Energy Information Agency. After removing the contribution of wind power from the aggregated figures, the historical production was again projected mathematically. In this case a linear trend line provided the best fit, which seems sensible - biomass is the largest contributor, and it is a very mature energy source, unlikely to exhibit exponential growth in the near future.
Figure 8: Other Renewable Energy Production, 1990 to 2100
Putting the Energy Sources in Perspective
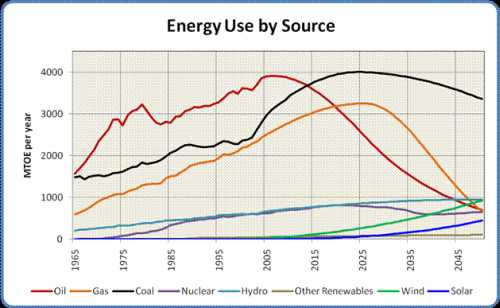
Figure 9: Energy Use by Source, 1965 to 2100
Figure 9 shows all the above curves on a single graph, giving us a sense of the relative timing of the various production peaks as well as the rates of increase or decline of the different sources. As you can see, fossil fuels are by far the most important contributors to the world's current energy mix, but oil and natural gas will decline rapidly over the coming decades. By the middle of the century the dominant player is coal, with oil, gas, hydro, nuclear power and renewables making very similar contributions to the world's mid-century energy supply.
Figure 10: The Global Energy Mix in 1965
Figure 11: The Global Energy Mix in 2005
Figure 12: The Global Energy Mix in 2050
Figures 10-12 shows the changing contribution of each energy source relative to the others over time. There are three interesting things to note about this progression.
The first is the large role that coal plays in the global supply picture. That situation is not entirely unexpected, but it hints at the difficulty we will have trying to replace our dirtiest and most dangerous energy source as our supplies of oil and gas decline.
The second is the increasing diversity of energy sources over time. This change is a good thing, as it indicates that various regions will have a much wider range of energy options available to them than in the past.
Finally, by mid-century energy sources that do not generate greenhouse gases may be supplying 40% of the world's power as opposed to 13% today and only 5% in 1965. Combined with an overall (albeit involuntary) reduction in global energy use by 2050, that shift bodes well for reducing the carbon dioxide our civilization exhales into the atmosphere.

Figure 13: Total Energy Use, 1965 to 2050
Figure 13 has all the energy curves added together to show the overall shape of total world energy consumption. This graph aggregates all the rises, peaks and declines to give a sense of the complete energy picture. The graph shows a strong peak in about 2020, with an ongoing decline out to 2050. The main reason for the decline is the loss of oil and gas. The decline is cushioned by an increase in hydro and renewables over the middle of the century, and averages out to 1% per year.
Fuel vs. Electricity
The energy we use can be broadly categorized into two classes, fuel and electricity. The former consists of oil and gas, the two sources that will be in decline over the next half century. The amount of electricity we produce from all other sources including coal will increase, though not enough to offset the decline in fuels in terms of the energy they supply. Figure 14 shows show how the split between the two classes of energy will change over the next 45 years.
Figure 14: Fuel and Electricity Use, Today and 2050
In addition to the loss of transportation mobility it represents, the loss of the enormous contributions of oil and natural gas means that the total amount of energy available to humanity by the middle of the century may be only 70% of the amount we use now. That shortfall contains an ominous message for our future that is the subject of the next section.
The Effect of Energy Decline on the World's Population
World Population Estimate
In order to assess the impact of declining energy supplies on the world's future population, we first need to establish what that population will be.
In the past I have argued that a drastic reduction in the world's population was likely over the course of the coming century. That expectation was based on my estimate of the impact of energy shortages, fresh water depletion, soil fertility depletion, the decimation of oceanic fish stocks, pollution, biodiversity loss, climate change and economic disruption. It is very hard to make that case, however - not because the problems I list aren't apparent, but because the causal links to human population decline are very difficult to establish conclusively.
Accordingly, for this analysis I have adopted the generally accepted population projection published by the United Nations: a decreasing rate of growth to a population of about 9 billion in 2050. This projection is known as the Medium Fertility Case. As you can see from the graph in Figure 15 it matches perfectly with the projected trend of actual population growth over the last 20 years.
Figure 15: Actual and projected World Population Growth, 1985 to 2050
The Effect on Average Per Capita Energy
One of the interesting, though very high-level, ways to measure of global wealth is to calculate the average energy available to each person on earth. While the resulting per capita average doesn't reflect the disparity between rich and poor individuals or nations or let us know what sorts of things people might do with their energy endowments, it can give us a general feeling for how "energy-wealthy" the average global citizen is, especially compared to other times.
Fortunately, the energy analysis we have just completed gives us the tool we need to establish this measure. By simply dividing the total energy available in each year by that year's population we can construct the graph shown in Figure 16.
Figure 16: Global Average Per Capita Energy Consumption, 1965 to 2050
As you can see, the rising population and falling energy supply combine to produce a falling per capita energy curve. In fact, if these models of energy and population are correct, we can expect to see a drop of almost 50% in average per capita energy by 2050, from 1.7 toe/person to 0.9 toe/person. Each person alive in 2050 will have available, on average, only half the energy they would have today.
The Effect on Countries
Unfortunately the world is not a uniform place, and measures like "average per capita energy" don't really tell us much about how the world might look in 2050. To gain a bit more insight it is helpful to think of the world as being composed of rich and poor nations, where their wealth is characterized by their total energy consumption and whose population growth is expressed in their Total Fertility Rate.
An interesting insight appears when you sort the world's nations by their per capita energy consumption. The nations and regions at the bottom of the consumption scale (Africa, Bangladesh, India, Pakistan, Peru, Indonesia and much of Southeast Asia) all have very high fertility rates, well over the replacement rate of 2.1 children per woman. In fact, when normalized for population size, the average TFR of the poor nations is 3.0. In contrast, the group containing all the other nations is well below the replacement fertility rate at around 1.8.
The implication is that poor nations are going to face double jeopardy. Their populations will increase even as their already low energy consumption drops further. In addition, as per capita energy consumption drops world-wide, some nations that are not currently considered "energy-poor" will be impoverished enough to join the group at the bottom, thereby swelling its ranks even further.
The Growing Divide Between Rich and Poor
In order to get some idea of the magnitude of this effect, I have associated each of the 63 countries or regional groupings in this analysis with their current population, total current energy consumption and their population in 2050. I have arbitrarily decided that a per capita consumption of 0.75 toe/yr is the dividing line between between poverty and wealth. 0.75 toe/yr is a bit less than half the present world average, and only one tenth of the energy consumed by an average American.
The countries and regions that currently fall below that poverty line include Bangladesh, Philippines, Pakistan, India, Peru, Indonesia, Ecuador, Colombia, Egypt, much of Africa, many Asian Pacific nations and some Eurasian countries. Altogether they have a population of about 3 billion people. The rest of the world's nations, from Algeria to Kuwait, are in the rich half of 3.5 billion people.
In order to assess the effect of declining average per capita income, I decided to spread the pain evenly. The assumption is that most countries will see a similar drop in their level of energy consumption. While that expectation may not be completely realistic, it seems close enough for the purpose of this exercise. The result is that countries with a per capita consumption between 0.75 and 1.5 toe/person will lose enough energy to be counted in the group of poor nations.
The countries and regions that drop from rich to poor status include Algeria, Turkey, Mexico, Thailand, much of Central and South America, the non-oil-producing nations of the Middle East, and - most significantly - China.
When we add up the populations in 2050 of the rich nations that are left, it comes out to only 1.6 billion. Remember, their populations fell due to lower fertility, there are fewer of them and they lost China to the ranks of the poor.
The population of the poor nations is where the shock comes. Their total population in 2050 adds up to over 7 billion people. That number is more than the total population of the Earth today, all living at an energy level somewhere between Bangladesh and Egypt.
Figure 17: World Population at low and high energy consumption levels, today and 2050
Conclusion
How many ways are there to say the world is heading for hard times? Losing most of our oil is bad enough, and losing most of our gas as well borders on the catastrophic. Combining these losses with the exponential growth of those nations that can least afford it is nothing short of cataclysmic. The ramifications spread out like ripples on a pond. There will be 7 billion people who will need fertilizer and irrigation water to survive, but would be too poor to buy it even at today's prices. Given the probable escalation in the costs of fertilizer and the diesel fuel or electricity for their water pumps, it isn't hard to understand why the spread of famine in energy-poor regions of the world seems virtually inevitable.
In normal times the poor would appeal to the rest of the world for food aid. However, these times may be anything but normal. Even the shrinking population of the rich world will see its wealth eroded by the drop in energy supplies and the increasing cost of producing the energy they do have. This decline in their wealth will in turn erode any surpluses they might otherwise have donated to international aid. In any event, there will be over twice as many hungry mouths crying for that aid, with less and less of it available.
This assessment doesn't even consider the converging and amplifying impacts of the other problems I mentioned above: the loss of soil fertility and fresh water, the death of the oceans, rising pollution, spreading extinctions and accelerating climate change.
The solution to this dilemma, if solution there may be, does not seem to lie in some Deus ex Machina or in a technological revision of the parable of the loaves and fishes. If the dark visions outlined in this article come true, we will be faced with a world in which the only way forward is to accept that Mother Nature does not negotiate. We must use our considerable intelligence to figure out ways to live within the ecological budget we have been allotted. More than that, we must change our values away from our current paradigm of growth, competition and exploitation to one of sustainability, cooperation and nurturing. The longer and tighter we cling to our present ways, the more damage we will ultimately inflict on ourselves and the world we live in. For many, the time for such a change has already passed. For a fortunate few there may yet be enough time to move toward the new ways of living and being that will be required in this brave new world.
Personnel
Archives
- December 2008 (1)
- October 2008 (1)
- July 2008 (2)
- June 2008 (2)
- May 2008 (6)
- January 2008 (2)
- December 2007 (8)
- November 2007 (9)
- October 2007 (11)
- September 2007 (14)
- August 2007 (14)
- July 2007 (10)
- June 2007 (9)
- May 2007 (11)
- April 2007 (9)
- March 2007 (11)
- February 2007 (11)
- January 2007 (11)
- December 2006 (12)
- November 2006 (16)
- October 2006 (13)
License

This work is licensed under a Creative Commons Attribution-Share Alike 3.0 United States License.
I just posted a note in DrumBeat about a new, extensive NPR/Marketplace (radio) series they're doing called Consumed: Is our consumer society sustainable? highlighting, in particular, an interview about "overshoot" with Jared Diamond. This is the first time I've heard the topic hit the general media in such a direct way. LINK HERE
So essentially this is about as good as it gets as far as energy availability. And we only get to stay at this point if we take immediate action, which we're not going to do.
Should be an interesting next ten years.
My research shows that the energy situation is even tighter. http://www.peakoilassociates.com/POAnalysis.html
Paul this is great work. Taking your conclusion at face value I have a feeling that the OECD could survive nicely on a 50% cut in energy use per capita. Better housing, more efficient travel and working practices, better efficiencey in agriculture, less pointless consumerism etc. Of course the economy may be totally screwed for years.
This is just a feeling - so I was wondering if you had a chart that showed how we use our energy - so we could see where painless cuts could be made.
Moving on to not take your work at face value, we could build in an acceleration in the building of renewables. Right now the driver is half hearted mitigation of climate change and when the world wakes up to energy decline do you not think we will see a vast expansion of wind and solar. In particular, you don't seem to include direct solar - virtually non-existant now but has massive potential. This is simple technology - a magnifying glass on a sunny day.
What's more, you mention famine and I'd tend to agree that we are facing global famine right now - so perhaps the population growth curve will be less agressive.
So there are a number of ways to tweak these variables that produce a better out come for many, simulatenous with a disaster for many others.
No doubt though we are headed for interesting and difficult times. The last half of the 20th century only provided a respite in human suffering.
One of the things I've realized in the last couple of weeks is that most of the technological "stuff" we are looking to for mitigation (the windmills and electric cars and vertical farming) may help a lot, but it's largely going to help the people who don't need helping anyway. It's probably not going to help the people who will really need it in 20 or 30 years, because they largely can't afford it now, and certainly won't be able to afford it in 25 years.
Can direct solar gain enough traction and provide enough benefit to the 6 billion people who will probably be living on two dollars a day in 2050, even if they are two 2006 dollars? All low-tech and alternative tech approaches will help someone somewhere, but we're soon going to be facing a giant balloon of impoverishment in the developing world that is going to be pretty intractable.
We may be faced with a triage situation: (I) those who will survive without help, (II) those who will die even with help, and (III) those who may survive with help. What has horrified me in my latest number crunching is just how big Category II will probably be, and how small Category III is likely to be.
I suspect the world will rapidly polarize into a bimodal distribution: we in the developed world will survive even without fourth generation photovoltaic panels, while 6 billion may not be able to afford fertilizer at 2050 prices.
This theme is going to be developed a little more in Part 2.
One of my first questions concerns your increase from 6 to 12% hydro. I just don't see where potential sites still exist, esp in the industrialized nations. Unless you see a big increase in pumped storage. As you note, it is doubtful the third world could afford the power.
What do you feel is the likelihood of North Africa becoming the powerhouse of Europe, through thermal and pv solar? At 6% in your chart, I imagine not much.
About the hydro, hey I'm trying to be optimistic here! You may be right, and that's one of the reasons I have the hydro curve flattening out over time.
About North Africa - anything is possible: "Predictions are hard, especially about the future." Solar PV and thermal will play a role somewhere, but if I had to bet I wouldn't bet on North Africa, unless Europe decides to fund it. And in that case I'd bet it would end up benefiting Europe a whole lot more than North Africa.
Actually hydro generation in US and in many other places has recently been falling.
Many factors affecting it - climate change, increased water demands for irrigation and by the population, everything adds up and the trend is negative. I can hardly see these factors reversing, quite the opposite actually.
Expecting hydro to raise its share world-wide is obviously assuming a massive program in the third world. How realistic this is I leave up to you to decide.
Unfortunately I have to conclude your optimism is quite crossing the borders of scientific realism. Same goes for wind - expecting it to surpass both hydro and nuclear based on a track record of 5 years, emerging from virtually non-existent source is... maybe way too much.
I'll let you and Pitt duke it out over the global prospects of hydro, and you and Nick can hash out the potential of wind while you're at it. For now I'm content to split the difference and disappoint both sides.
Significant hydro development may be confined to China and Canada, but I'd bet South America and Russia will put on a push as well. Regarding wind and solar, ¿Quién sabe?
No need for duking - we're gathering evidence, not disagreeing.
LevinK is pointing out that hydro production is falling in some places, although - as your graph shows - it's still growing overall and is currently at its highest level ever. I'm pointing out that substantial hydro potential still exists, even in some developed countries. No conflict.
Two things to keep in mind:
1) It's about a 50% increase in output, as compared to a 100% increase in share.
2) This list suggests China, at least, has substantial hydro potential left, as may Canada. According to this estimate from Turkey, the amount of economically viable hydro power in the world is about 9TWh/yr, or about triple its current level.
So it may not be unreasonable.
All dams should be taken down now.
Salmon Advocates Say Kill Dams, Not Sea Lions* - The NewStandard
The Commission could not kill more than one percent of the sea lion population. ... with mortality rates on some rivers reaching 92 percent, according to ...
newstandardnews.net/content/index.cfm/items/4688
What's being proposed here is human feed lots
and no other creature is necessary.
Thee Yangtze, Colorado and the Nile are not making it
to the sea.
We don't have five years. Bakhtiari's WOCAP Model
is the operative one.
I note that financing these wonderous projects
is verboten here.
Reason:
We have no idea how much debt is in the World now.
Since 07/17/07 the process has begun to find out.
With the DJIA at less than 12 750 hedge funds will be carried
out feet first.
From CalculatedRisk:
That’s actually why I find those emails quoted in the indictment to be so explosive. I have spent a lot of years learning to decipher coded language about regulatory-not-exactly-improprieties-but-perhaps-areas-of-concern and other corporate-speak ways of putting it that I’m utterly blown away by the unvarnished language being used here. You just don’t accuse a major account like WaMu of out-and-out violation of safety and soundness regulation unless the conduct is egregious in the extreme, or you think it is clear that you are being lined up for bagholder duty, or both. It sure sounds to me like WaMu wanted to tell eAppraiseIT what to do, while having eAppraiseIT do the scut work plus the small matter of making all the relevant warranties in the utterly certain event it backfired. Mortgage market participants can be so amazingly short-sighted sometimes it’s hard to believe, but somebody at eAppraiseIT seems to have figured out who the sucker at the table was. No doubt they wouldn’t be on the receiving end of a civil suit from Mr. Cuomo if someone higher-up had listened to whatever internal employee called bull on this one.
Why didn’t they listen? Why doesn’t any corporation ever listen? Because the WaMu account is huge, and nobody wants to stop a gravy train. The indictment also includes snippets of emails suggesting that WaMu dangled other business relationships outside the appraisal management function in front of First American if it rolled over. Which is more or less exactly what lenders to do appraisers all the time: offer repeat business if they play ball, or being kicked off the team if they don’t.
...These days appraisers have the same pressures to play ball and absolutely none of the protections of being employees. I wonder if we haven’t gotten to that point where someone with nothing left to lose has nothing left to lose. The lenders are asking appraisers to take personal liability for inflated appraisals, while offering them no salary (protection from falling volume cycles), no benefits, no institutional legal or compliance support. Even the per-deal fee we pay has become typically paid only out of closing proceeds. (We used to pay for the appraisals up front out of an application fee, so the appraiser got paid even if the loan didn’t close. These days the appraiser often never gets paid if the loan doesn’t close because the broker has nothing to pay it with.) And guess who is the target of the Cuomo indictment? Not the lender doing the bullying. At some point these appraisers have to realize that they don’t lose much by going state’s evidence and providing the other half of those email chains. And that would mean a Very Bad No Good Rotten Day for everybody."
http://calculatedrisk.blogspot.com/2007/11/whats-wrong-with-approved-app...
Nobody wants to stop the gravy train, but too many people
are noting that the bridge ahead has been taken out
and not only are the brakes not being applied but the engineers are trying to figure out how to accelerate
the train further.
Arkansaw of Samuel L Clemens
I think it is a given that in the near to medium term (up to 5-10 years) we will have a financial "reset" in the developed world - most likely taking the form of hyperinflation, wiping out all those debts.
Whatever comes next will have to be more sustainable (likely to be much more regulated system) and will be able to provide the financial basis for the projects on the line. After the day of reckoning people will have to finally deal with the fact that superstition based capitalism can't last long.
My take, IMHO (thanx for the reply BTW-;}):
We are having hyperinflation (HI) now.
That's how the Top 1% Bonuses are being factored.
$160 million Golden Parachutes for "humiliated" Merrill CEO,
for instance.
The HI is being hidden in the $415 Trillion SIV's.
What's happening now is that the HI's being exposed.
A wheelbarrow full of SIV's can buy a loaf of bread-
h/t Weimar Republic.
But investors are demanding return of their principle.
Fear stalks the streets.
What do you actually have in your hand now.
That's deflation.
Pennies become dollars.
A coke for a nickel. A beer for 15 cents.
The only MegaProjects are Gov't CCC Work Projects.
Arkansaw of Samuel L Clemens
I still think it is a push, but thanks for your links. The problems we have had recently in filling reservoirs to generating capacity weighs heavy, and I think this will get progressively worse with climate change. Properly sizing a watershed for hydroelectric potential and reservoir size requires decades of flow regimes, and I think future variability will make this a tough call.
Your Canadian link states that hydro is a consequence of climate and topography, and goes on "Practically all hydroelectric-power sites in Canada that are reasonably close to load centres have been developed". The remaining potential is the far north, developed at great economic and environmental cost. I don't believe many such schemes, like the idea of reversing the flow of Quebec watersheds some years past, will make it in the future.
I don't wish to dwell on the environmental costs of large hydro, but they are considerable. The costs of China's Three Gorges is still being tabulated, and in the northwest, I wonder how long we will continue trucking or barging smolts to the ocean. (There are some new developments and ideas for free swimming passage)
Another issue inadequately addressed is reservoir silting. I am a guarded proponent of hydro, including microhydro where I see many small drops in the bucket, but skeptical in it's ability to supply significant postpeak energy.
There is something called Lake Effect. When the lakes and seas in cold regions are iced over, they stop supplying moisture for rain and snow. If they are still open during the cold part of the year, you can get some amazingly deep snowfalls.
If the Arctic ice cap doesn't form next year, Canada's hydroelectric potential could take a sudden jump.
The developed world will have to restrict it's use of energy resources. I doubt the Category II people will just agree to go away and die peacefully.
The developed world will not voluntarily impoverish itself in anyone else's favour. The good folks in Category II will not agree to just go away and die. What's the outcome?
If it comes to that, and it probably will, war. However, cutting the U.S. share of energy consumption from 30% to 15% wouldn't necessarily impoverish us. Doing it in time would require close to socialism in the U.S. although.
I'm also thinking that the Category I folks may not be who you think they are. Most of the developed world has exhausted its cheap energy resources. At some point the Category II and III people are going to figure out they should keep their resources for themselves and not sell them to the developed world for worthless pieces of paper.
TJ,
I agree that the poor will realize they are being screwed and become somewhat unruly. However, we then move into the realm of nastiness.
Already I've heard the phrase "resource nationalism" popping up here and there. When we use it about some country, like Venezuela, or Russia; it isn't meant positively.
It's meant to emply that they are using their resources to promote a narrow, nationalistic, political agenda, and that this is illigitimate and unfair. They are also undermining the workings of the free market.
The poorest people in the world don't have money for fertilyzer today. How can their life get any worse?
It's like that Alabama song. "Somebody said that Wall Street fell. We were so poor that we couldn't tell." Civilization will come to an end and the sharecroppers will just continue subsistence cropping away, same old same old.
RobertInTucson
I haven't escaped from reality. I have a daypass.
writerman,
I guess I'm just a commie rat, but I cant see a lot of difference between Venezuela or Russia using its resources for a narrow, nationalistic political agenda and a multinationalal oil company using the money from its production to have a country promote its political/economic agenda as in Exxon and Chevron having the US invade Iraq so they could bid on producing the Iraqi fields under the proposed "oil law" that was dropped as a political hot potato 2 or 3 months ago.
Its a myth that the oil markets have ever been "free". The economic event that made oil into the primary transportation fuel for our economy was switching the navies and the railroads to oil as a fuel from coal, which happened about 1910-1920 for the US and Great Britain. Once that happened oil became of such strategic value that countries began entire military campaigns based on access to oil. Being able to ship men and material quickly is the difference between military campaigns 150 years ago and today. Surely no one thinks that the US military could survive in Iraq on the local food and march to and from engagements, which is how all armies operated for all time before the invention of the railroad, military trucks and navy landing vessels powered by engines instead of oil and airforces.
The end of dense easily transported fossil fuels is going to totally change the nature of war.I expect to see most of the remaining oil confiscated by the militaries of the countries that have oil. That's why Jeffry Brown's Export Land phenomena is inevitable. The countries that see that the effectiveness of their military is dependent on fuel for military transportation will force all oil importers to stop net exports out of their countries. And its probably why the Russians will win in the end unless the US can keep up its empire in the middle east.
I'm an elderly hippy and a peacenik. I'd love to see an end to war, but global wars won't end until all the dense energy fossil fuels are gone. Its hard to see armies operating off of solar arrays and wind turbines. If pocket nfission reactors are possible then all bets are off, but I can't see that modern military can survive the end of oil and coal. The question is can humanity survive the end of oil and coal. Bob Ebersole
The developed world will not voluntarily impoverish itself in anyone else's favour. The good folks in Category II will not agree to just go away and die. What's the outcome?
Speak for yourself. I would gladly enter on the path of energy decent to try to mitigate the coming disaster in the developing world. Are you saying that you are unwilling to give up wealth? Or are you claiming that you yourself are generous and everyone else is an egotistical bastard? I think that concentrating on technologies that can work for everyone is will benefit ourselves as well. For example rather than concentrating on developing highly expensive lithium batteries for hybrid automobiles and planning on using car batteries for balancing the grid, we should concentrate on developing a low cost storage battery based on an abundant material like iron or aluminum (unfortunately lead production is likely to decline in the not too distant future) in order to allow distributed small scale generation from wind or PV. I think that in a couple of decades time we will need such batteries a lot more than we will need hybrid automobiles. We should also be giving top priority to developing local systems of food production which preserve topsoil and recycle nutrients even if such systems are more labor intensive than current agricultural practices and therefore hurt our economy by moving labor resources from other manufacturing enterprises. Our willingness to spend down our resources of top soil in return for short term luxury is one in the surest signs of the structural insanity of our current economic system. The attempt hang on to as much of what we have for as long as possible will make the transition from an economy which assumes that the world is both an infinite mine and an infinite garbage dump, to one in which we live in dynamic equilibrium with the biosphere even more painful and disastrous than it would be otherwise.
"we should concentrate on developing a low cost storage battery based on an abundant material like iron or aluminum (unfortunately lead production is likely to decline in the not too distant future) in order to allow distributed small scale generation from wind or PV."
I have nothing against batteries of the kind you mention but there are some possible options of going beyond that.
Title:
Lightweight flywheel containment
Document Type and Number:
United States Patent 6756091
Link to this page:
http://www.freepatentsonline.com/6756091.html
Abstract:
A lightweight flywheel containment composed of a combination of layers of various material which absorb the energy of a flywheel structural failure. The various layers of material act as a vacuum barrier, momentum spreader, energy absorber, and reaction plate. The flywheel containment structure has been experimentally demonstrated to contain carbon fiber fragments with a velocity of 1,000 m/s and has an aerial density of less than 6.5 g/square centimeters. The flywheel containment, may for example, be composed of an inner high toughness structural layer, and energy absorbing layer, and an outer support layer. Optionally, a layer of impedance matching material may be utilized intermediate the flywheel rotor and the inner high toughness layer.
http://www.sae.org/technical/papers/981276
Title: A High Useable Energy Density Flywheel System Making Solar-Powered Hale Uav a Realistic Technology
Document Number: 981276
http://www.nec.co.jp/eco/en/2007_1/h03.html
"Like Metal!"
- Development of Bioplastic with High Thermal Conductance
So the fate of mankind depends on his ability to get rich?
I better do whatever it takes, I mean whatever it takes, so that My children might survive.
This is one F*#@ed world we live in.
Has it ever been any different?
No, it has never been any different, which is why individuals and societies can't rely for a decent future on a model of perfecting human nature. You have to come up with solutions that work within human nature.
For example, someone in this thread asked whether there will be capital available for financing energy efficiency and alternative energy projects. There will be capital available, but the question will be whether it can be pried out of the hands of those who have it. The answer will depend at least partly on decisions being made right now. For example, should the Fed cut interest rates even if it leads to higher inflation, or should the Fed maintain or even raise rates to protect the dollar at the risk of deflation?
The answer is to choose inflation, because it forces the holders of capital to keep their money in the game. Inflation is like an ante or blinds, it forces action. (You can't just sit there on your chips or you soon go broke.) But if deflation gets started, all the holders of capital have to do is sit and watch risk-free as stuff gets cheaper and the cash in their mattresses gets more valuable.
Paul,
A really excellent and sobering piece, there's an awful lot of stuff here to mull over.
I remember reading stuff like this eons ago, like in the "Population Bomb" and "Limits to Growth" and look were still here and everyone I now is far, far, richer than ever before!
Only this time I have a feeling it might be very different.
One of the things I think we'll see is a truly massive growth in the gap between the lifestyles of the rich and poor, not just between us and the poor sods in the third world, but also in the rich world. This is a trend that is already very apparent almost everywhere to a greater or lesser degree, but the trend is unmistakable.
Like I said I believe it'll get dramatically worse. Society will become extremely polarized economically. I think we'll see parallel or multi-tierd systems evolving. Like with healthcare and education, only more and more areas of society will follow this pattern.
One can already see this in the rapid growth of private security guards and the veritable explosion of private armies. There are thought to be around 100,000 private soldiers or mercenaries operating in Iraq at the moment.
I think the elites will retreat behind guarded walls, like they've lived for most of mankinds history, and the rest of us will scratch a living outside. If we get out of hand...
It seems to me that healthcare is a special case. Knock out the middle and lower class access to healthcare, and the system falls apart. The "electrician" cardiologists, cheap vaccines and drugs, the mountains of research dollars or cost of state of the art hospitals need the subsidy of the middle and lower class. They won't stand by themselves on fees from the wealthy.
BS
Most folks choose to lead a perfectly adequate life of moderation but apparently, that is no longer an option thanks in no small part to “financial engineering” and the push for endless wealth.
Nice shot at rationalizing though.
Moe, thanks for an easy-to-understand analogy of why Ben Bernanke regards inflation as infinitely preferable to deflation.
PLAN, PLANt, PLANet
Errol in Miami
Moe_Gamble
its only 150 years since it was perfectly acceptable behavoiur to beat and torture other people to work them to work for free, and to exterminate other people in order to steal their land and consider them sub-human because they were less technologicially advanced tha us. I'm speaking of slavery and the Indian wars, enshrined in that most sacred of documents, the Constitution of the United States of America. Humanity is improving, and fairly quickly considering the long history of war and slavery.
No, we can't rely on this improvement any more than we can rely on any other future projection. The answer to almost all of these improvements is education. History shows us what's possible and the methods that work, and paths to progress. The altruism of America at the end of WWII and the marvelous results from rebuilding our enemy's countries shows what works. Because we were generous with the Japanese and Germans they've become great world citizens and our allies.
The opposite behaviour was shown by the US at the collapse of the Soviet Union. We missed an opportunity to bring peace and prosperity to the formerly communist countries thanks to the greed of the capitalist world view.
We've got the opportunity to be generous again and solve both climate change and the psychotic evils caused by poverty. Approximately 1.6 billion people on the planet live with no electricity, no clean water and no access to any education. Their lives are hopeless, they live on less than $2 American a day, most of them are destitute women without skills in no-western societies. Their children are the kids who become suicide bombers . They are fertile because a child has economic value when you can put him to work in the fields at six or sll her for a sex slave.
If we'd help the deperately poor get renwable energy enough to run lights at night and a computer during the day and provide enough education and access to the internet we'd provide them with hope of a better future for their children. The money it would cost would be about the same price as our collective defense budgets for a few years, and it might result in world peace and prosperity by focusing on something other than greed and war. If we can imagine something, its possible. And it would both save the climate and bring peace and prosperity.
Bob Ebersole
I agree, Paul has put together some excellent work. I also agree with Euan that energy use efficiency and an acceleration of new energy sources could help the situation. We will need much more enlightened political leadership, especially in North America and China, for this to happen. One area where Paul's model may be too optimistic is that there may be less capital available for manufacturing and constructing new energy infrastructure once we have passed peak oil and peak natural gas.
Another tweak to Paul's model could include thorium fuel retrofits to light water reactors and CANDU reactors. This can easily be implemented soon enough to eliminate possible future reductions in U-235 availability.
The decline in capital (specifically the decline in national GDPs) will be addressed in Part 2.
Regarding thorium, pebble beds and IFRs I deliberately excluded them because once you start throwing in speculative technological changes you can't tell where to stop. I decided to stay conservative in that regard.
Thorium in fission reactors goes back at least to the sixties. I was there. (Google General Atomic or HTGR)
Pebble Bed Reactors are not speculative technology.
Gas Cooled Fast Reactors are not speculative technology. Solar Power and Wind are not speculative technology.
You sign the check, you get the plant.
Solar has the fastest ramp up because we can divert 20% efficient solar panels to 2,000% efficient 100X solar concentrators in about six months. There is no chokepoint in the manufacture of concentrators.
Then we go with wind, figuring on about three years to build the capability to manufacture more of the rather expensive gear boxes and blades. The rest of wind is pretty much off the shelf.
Gas Cooled Fast Reactors need lots of uranium metal production, fabrication, and enrichment facilities. These take longer. Pressure vessals are the chokepoint. Building something 30 feel around, three feet thick, out of steel, is not something you can just do in a garage. You have to build about the world's biggest forge and retrain a lot of welders.
Pebble Bed reactors are buildable. They just don't make a lot of sense. Why not the standard Pressurised Water Reactors? We haven't got the technology to cheaply recycle used fuel yet, in competition with enriched uranium at the present price, anyway, so their breeder capability for thorium cycle isn't really applicable.
Thorium fuel can be used in Pressurized Water Reactors, which would be much easier than switching to gas cooled reactors. But you are right on your last point - just reprocessing existing fuel would stretch uranium/plutonium supplies a long way into the future. However, the thorium cycle has some other advantages in terms of reducing waste and proliferation issues.
Euan,
Here is some info on transport for the US at least The source is table 6 from the 2001 National houshold Travel Survey
To or from Work 28%
Shopping 14%
Social & Recreational 24%
Family or Personal Business 19%
Other 15%
There is plenty of room for adjustment in the consumption of energy used in driving. However, as we both know that will require a lifestyle change that may be much harder to accomplish than we think.
By the way I am the fellow who probably overdid the Thank You to you and Stuart in Houston. Anyway thanks again. Take care.
Paul, this is exactly the sort on analysis that needs to be developed, and many thanks for putting in the time, effort, and critical thinking needed to bring it to us.
I would add my support for the possibility expressed by Euan, and others, that the scale up of other sources of energy, particularly renewables, can and will happen much more quickly than you envisage. Three particular examples which illustrate this are wind, Concentrating Solar Thermal (CST), and thin-film Photovoltaics (thPV). SOme points on this perspective:
1. At the moment the pressure behind developing and scaling up these energy sources is what could be called ‘weak forces’ - most of the incentive is coming from a mediocre response to the threat of climate change. Peak Energy on the other hand will provide ‘strong forces’.
2. The ‘strong forces’ are potentially very strong - For example here in the UK, we already pay the equivalent of about $300 a barrel (of oil) for gasoline, without much impact on how we drive.
3. CST looks as if it could provide essentially unlimited amounts of 24/(nearly)7 electricity at prices not very different to cost of conventional electricity today. Some key facts - Solel inc http://www.solel.com/ is building a 553 MW CST plant for PG&E in the Mojave desert; Ausra is building 1000MW of CST capacity for PG&E and |Florida light and power http://www.ausra.com/news/releases/070927.html .
4. Wind power is clearly going to play a major role.
An area of about 100miles x 100 miles in Nevada using current Ausra or Solel technology could provide all of the current electricity needs of the USA. In Europe, ‘under strong forces’ we could get our act together and build such plants in southern Spain and/or North Africa and transmit the power north, as envisaged (for 15% of Europes needs) in the German Aerospace Center report on the ‘Trans CSP’ http://www.dlr.de/tt/desktopdefault.aspx/tabid-2885/4422_read-6588/
5. In terms of day-time decentralised electricity generation, an already emerging new generation of solar PV panels will cost less than $1/W to manufacture, and are much easier to scale up than current silicon wafer PV manufacturing processes. This week First Solar Inc http://www.firstsolar.com/ released it’s Q3 2007 financial results, which show on an audited basis that they are already down to $1.15/W Cadmium Telluride PV manufacturing costs. See also Nanosolar http://www.nanosolar.com/ . When the retail price of panels becomes determined by these sorts of manufacturing costs, the panels will immediately be cost effective for daytime electricity production by consumers in many regions.
6. So I think that there are good grounds for predicting that sometime after Peak (Fossil Fuel) Energy, we will return to a world of cheap, relatively unlimited, non-polluting and secure energy. This energy will probably be even cheaper than it is today.
7. It appears that we can do this with existing technology of kinds which are currently being ramped up. Only one extra breakthrough is really needed to achieve current or better than current energy convenience, that is a breakthrough in the energy density and cost of rechargeable batteries.
8. It seems to me, that the critical issue, is at what rate can we scale these new technologies under the strong forces. My guess is that we can and will do so much faster than envisioned in your current post. Equally it seems obvious that as per your post, there will nevertheless be an interim period where there is some pain, e.g. a phase of recession and higher levels of unemployment, in the developed world, and some disastrous consequences for the poor and week.
It would be great to see the skills of TOD contributors applied to developing and modelling ramp-up scenarios for these replacement sources of energy.
My guess (but I would like to see something more scientific!) is that the forces for this change over will be strong enough to change to the new paradigm within about 20 years.
One of the aspects of the new era will be that the costs of electric energy will put a fairly low price on the upper limit on the competitive price of fossil fuel - at about $20 or so per barrel or so of oil. At some point this will hopefully cap enthusiasm for investing in very expensive, long pay-back projects for extracting non-conventional fossil fuels.
In a sense the economists will have been proved right - market forces will have responded, but not by replacing cheap oil with expensive oil, but by replacing cheap oil with cheap electricity.
I find it heartening to think that the only sources of energy than can respond indefinitely to market forces, may turn out to be those that are renewable.
Homo Semi-Sapiens.
The price of PVsolar may be coming down for two
reasons: 1) economies of scale; 2) cheaper methods of
production. However, even at the current cost,
governments may find it advantageous to provide
financing and/or incentives to make it easily a better
investment than a new car!
Unfortunately, the 'will' to make the changes and
to consider the necessity of doing this to 1) mitigate
the disaster that will be peak oil, and 2) avoid the
horrific peril of using coal--that political 'will' does
not yet exist. But that can change quickly as the
price of oil continues to rise.
There's no way the price of a barrel of oil ever gets
cheaper. PVSolar means the price of electricity goes
up compared to natural gas.
And more troubling, the price of PVsolar goes up with
the price of oil. This, as many have pointed out, is
a difficult calculation to make: does the skyrocketing
price of oil prevent the development of a serious
investment in infrastructure for wind, solar, and
other alternatives?
I suspect that well before 2025, people, by and
large, take up gardening and have a couple of solar
panels to drive their scaled-back electricity needs.
Transportation infrastructure cannot be replaced by
solar or wind or even coal or nuclear.
This is the big problem: no cheap transportation.
And the biggest problem: no cheap food.
Cuba is an example of how we might survive...
Peak oil, by my analysis, seems to imply
catastrophic change... The time to have made
gradual change was back in the 1970s. No political
will back then either. So catastrophe is what
happens to bacteria in a petri dish. So far,
we have not distinguished ourselves from bacteria
in the department of foresight.
Do you envisage any possible downside to humanity finding itself in such a situation?
With just the energy we have had at our disposal we have strip-mined the soil, cut down 90% of the world's boreal forests, emptied the oceans of life and re-filled them with plastic, driven countless species to extinction and melted the planet's glaciers. I am not optimistic that our species' judgment or behaviour would improve under the circumstances you propose.
I try to imagine 9 billion people all living a nice comfortable first world lifestyle and my blood runs cold. Does other life have intrinsic value, or does the world consist simply of human beings and resources?
All available ecological niches have been or are being filled by homo sapiens. There may be some marginal exceptions such as starlings, raccoons, cockroaches and the like.
I don't believe the average city dweller believes that anything needs to be or even belongs on earth except people and their stuff.
Paul,
The point I am making is technical rather than judgmental. I thought the core of your post was about the future availability of power, and how this might affect people and the planet. In that context I think it important to understand whether or not there is going to be a return to lots of cheap energy. To the extent that your point is that we are overpopulating and abusing the planet, then we are in complete agreement.
However, the objective evidence, is that poverty is associated with higher birth rates, and with even less regard for caring for the planet, so I do not think that a perpetual energy price increase and restriction on availability would help to meet our shared goals.
I'm not sure that's clear. From the sounds of it, drivers in the UK log about 30% fewer miles per year than drivers in the US (9,600 vs. 13,800), and drive cars that are 35% more efficient (26.5mpg vs. 19.5mpg, both US gallons), for a total oil-for-cars reduction of 0.7/1.35 = ~50%.
So I would argue that the UK experience shows people's behaviour is actually pretty amenable to change under the effect of high oil prices or similar constraints.
Pit, you are quite right, and when I made the point I worried that it was oversimplified for the sake of brevity.
I think in England, we drive a shorter total distance per year more because of 60M people being crammed into a small island, and my guess is that we do about as many trips per capita as are done in the USA, just the trips are shorter.
On the mpg of our vehicles, I agree that the price of fuel over the long term has impacted our vehicle fleet, relative to the USA.
However, my point still is that it is sobering, how strong our imperative is to find a way of continue to drive around, even with our high fuel price, of about $7.50 a US gallon.
I was wondering if you had a chart that showed how we use our energy - so we could see where painless cuts could be made.
Euan,
The Lawrence Livermore Laboratory produced a very interesting chart a few years ago, showing the energy flow in the U.S. economy:
https://eed.llnl.gov/flow/02flow.php
The majority of the energy produced is wasted. Over two-thirds of the energy in the electrical grid and eighty percent of the energy in the transportation system is lost. These two areas are the "lowest hanging fruit" where cuts could be made -- but whether both systems can reinvent themselves in time to avoid what's coming is debatable...
gwb and Euan,
around TOD people repeat a number of fallacies about energy often enough to where they are taken as gospel, without further excamination even though we need to reexamine our beliefs about energy very often. One of the oft repeated fallacies is the "low hanging fruit" cliche. The invention of the compact florescent light bulb and its common distribution lowered a lot branches. Alan Drake's Electrification Of Transportation shows an affordable method of eliminating at least 20% of the US useage of liquid transportation fuels. Cafe standards could quite easily eliminate new non-hybrid internal combustion engines in cars. But somehow we seem to have a paralysis even among progressives and environmentals about talking about real solutions to the peak oil problem in the world. Bob Ebersole
The majority of the energy produced is wasted. Over two-thirds of the energy in the electrical grid and eighty percent of the energy in the transportation system is lost.
Your statement is misleading. Most of the energy lost in the electric sector is lost because of the low conversion efficiency of thermal plants. A coal plant for example, loses 60% of its primary energy. The obvious way to raise this efficiency would be to build IGCC plants and/or utilize more low energy heat for industrial purposes or residential heating. All of these fixes require major infrastructure investments.
For the transport sector the obvious fix is public transport (major infrastructure investment), or electric vehicles. I would argue that for electric vehicles, the problem is similar to PV electricity: -Too little production capacity that takes too long to ramp up (batteries especially), and presently; too high cost.
Geothermal and tidal are looking pretty promising, I would think that the long term outlook would be exponential rather than linear.
I suspect that as declining FF supply make it clear that we can't continue BAU, there would be an additional step up in wind and solar as well. Whether nuclear can be safely ramped up a bit more is uncertain, but I'm sure that TPTB will try. Biomass, on the other hand, may have to level off; otherwise, the diversion from food supplies will just be too much.
Nevertheless, it is clear that there is no combination of realistic energy futures that can sustain the world at existing per capita levels of energy use. Demand must fall to lower levels, and this requires a massive adjustment in energy use and entire economies, one way or another. Most likely, said adjustment will be a mix bag of responses.
Think about the implications of Figure 17. Geothermal, tidal, they're all great technologies. But if we wind up with 7 billion people living on a subsistence energy budget, who are those technologies going to help? The people who need them or the people who can pay for them?
In the case of geothermal & tidal, they are going to help the people who live near to the suitable sites -- IF they can come up with the money to develop the systems.
Some people will unfortunately end up being beyond help under any realistic scenario. That is a tragedy, but I just don't know what we can do about it.
Other people will be in a situation where they will have to make some very hard choices. There will be poor nations with some geothermal or tidal (or hydro, or wind, or solar) potential. They might have to develop it on the cheap, and it might not take them very far, and they might have to forego a lot of other things that they really need. If they don't bite the bullet and do it, then they will indeed end up with virtually no energy at all, and will end up in the "beyond help" camp. I suspect that quite a few nations, when push comes to shove, will bite that bullet.
The same dynamic plays out in more fortunate nations, like the US and Canada. We are actually fortunate enough to have multiple options. Both the US and Canada have plenty of potential for solar (more so in the US), wind, hydro (mostly, but not entirely developed already), geothermal, & tidal, not to mention biomass (controversial and questionable though it may be). When you look at all of it, one should almost feel silly for worrying about our energy future.
The catch, of course, is that while our potential renewable energy resources are abundant, our financial resources to invest in their development are not. Just like the poor countries, we've also got to make hard choices. There are multiple opportunity cost curves in place between different renewables, between renewables and non-enewables, between supply development and energy efficience (e.r., electrified rail transport), and between investments for the future vs. present consumption. In the absence of strong government leadership, the "market" is making its own decisions wrt these tradeoffs. Unfortunately, future generations have no "dollar vote" to cast in the market, thus the decisions are not being optimized for our long-term survival.
we have spent the last century building
an unsustainable world and 7 billion people won't
have enough food.
how can we make the transition back to a
more agrarian model?
reorganization must surely be required to avoid
large-scale famine.
Cuba is an example worth studying as they went
through the 'peak' experience and survived.
The price of oil will skyrocket eventually;
and that pushes up the price of everything:
including the cost for alternatives.
If the price of oil doubles, the cost of food may
increase ten-fold or more.
Why? Do a thermodynamic analysis. One calorie of
supermarket meat requires what, 100 calories of
fossil fuel? I see that many have written about
grains as 1:10, so meat creation, a wasteful and
entropic effort, would turn that ratio into 1:100.
But honestly, this is probably a grotesquely
inadequate estimate. The waste is surely greater.
If anyone has read a good paper on
the thermodynamic analysis of food, please post it.
As a counterpoint to the often-quoted example of Cuba, consider North Korea. Their oil was cut off at the same time and for the same reasons. Their outcome has been significantly different, mainly due to their lousy weather, inhospitable terrain for agriculture, and a government with a severe case of recto-cranial inversion. If human nature holds true and the first thing people reach for when TSHTF is a nice "strong" government, I suspect that for every new Cuba in the future there will be at least one more North Korea.
Your point about the EROEI of meat is well taken. I also wonder what an escalation of 10x to 50x in the cost of nitrogen fertilizer over the next 30 years would do to grain production in the developing world?
You can't get nitrogen fertiliser costs to go up more than a factor of two as long as there is coal in the world, nor more than a factor of four as long as there is wind.
Note that I did not say that you couldn't get nitrogen fertilise prices to go up.
I wonder about the long-term cost of hydrogen from windmill electricity - it seems to me that the electricity they generate will have competing uses that could easily drive up the cost of hydrogen from that source. If my projection for the amount of wind power we'll have in 2050 is close to correct, I wonder how much of it could or would be diverted to hydrogen production?
I spoke to a retired engineer and Club of Rome member last week who spent part of his life in steel and coke-making, then most of last 30 years as a coal policy analyst and advisor to the Canadian government. I asked him specifically about hydrogen from coal, and his opinion was that widespread commercial operations are still well off in the future (actually he said something more like "never happen"). He talked about visible evidence of explosions in the plants he visited. Maybe he was BSing me, but he sounded awfully sure of his facts.
Globally we we currently use about 10 billion cubic feet of natural gas per day for fertilizer (between 3% and 4% of our total consumption of 275 Bcfpd). That means we must use use around 20 billion cubic feet of hydrogen for fertilizer, since the hydrogen from 1 mole of CH4 makes 2 moles of H2. Do you have references to the energy cost of hydrogen made by electrolysis or coal?
I found some numbers. It takes about 4.5 KWh to electrolyze 1 cubic meter of hydrogen. Back-of-the-envelope calculations reveal it would require about 2.5 TWh/day to produce the hydrogen currently used in global fertilizer production. About 425,000 MW of wind turbine capacity would be needed to produce that power.
At $0.05/KWh the cost of hydrogen from electrolysis would be about $0.25 per cubic meter. We can get a cubic meter of hydrogen from half a cubic meter of natural gas, so the cost of hydrogen from electrolysis is about twice the price of hydrogen from NG at today's prices (~$250 USD/1000 m^3).
I expect that natural gas prices will soar over the next 40 years. 85% of the cost of fertilizer is due to the cost of NG, so if the hydrogen from NG were gradually replaced with electrolyzed hydrogen, fertilizer prices would be expected to double (at a minimum) due to the higher cost of the hydrogen feedstock.
Much of the rising cost impact on fertilizer in developing countries will depend on how much of that 425,000 MW of capacity we can get installed by then - and remember this capacity requirement is in addition to our raw electricity requirements. Even using stranded gas would raise the cost of fertilizer, as that gas is more expensive to produce.
Rising regional demand for fertilizer in the third world will also push up the costs. Remember that so far we've only talked about replacing the feedstock for today's fertilizer production. The developing world may see a doubling of its population with an unchanged (or even diminishing) stock of arable land. That mismatch implies a massive increase in fertilizer requirement in those countries to raise per-hectare yields - perhaps 5x as much or even more due to the diminishing returns of marginal fertilizer application.
This will take some further thought to flesh out. Comments are needed...
" Even using stranded gas would raise the cost of fertilizer, as that gas is more expensive to produce."
I'm not clear on that. In fact, there's a lot of NG in places like Nigeria that's just being flared. Surely that would be really, really cheap to use locally for fertilizer.
According to the World Bank, whose number is quoted here the total amount of natural gas flared world-wide today is 150 billion cubic meters per year, or 400 million cubic meters per day. We use around a billion cubic meters of NG a day for fertilizer now, so there's obviously an opportunity there. However, that NG is associated with oil extraction, and as the oil declines, so does the associated gas. If oil production declines by 75% over the next 40 years, the amount of flared gas will go down proportionally, leaving a recoverable volume of just 100 million m^3 per day - 10% of the global requirement for fertilizer, which will be rising, not falling.
Well, I mentioned flared gas in Nigeria, because that's an especially egregious waste of gas, and it makes it clear that the resource is in surplus there.
AFAIK most stranded gas is kept in place as much as possible (sometimes to maintain oil reservoir pressure, sometimes just as a sensible way to manage a resource), and flaring statistics aren't a strong indicator of the overall resource. For instance, there's a great deal of gas in Alaska and Canada that's stranded, and awaiting a very large proposed pipeline.
"I wonder about the long-term cost of hydrogen from windmill electricity - it seems to me that the electricity they generate will have competing uses that could easily drive up the cost of hydrogen from that source."
IOW, the price of electricity will rise. Meanwhile, the cost electricity from wind is dropping. How could wind capacity grow at only 7% per year in the 2030's, when wind production would be enormously profitable, and we've identified no signicant barriers to it's growth? Remember, fertilizer is easy to transport, so you could put wind turbines anywhere in the world for fertilizer production - no siting problems, no transmission problems, no NIMBY. It makes no sense.
"I asked him specifically about hydrogen from coal, and his opinion was that widespread commercial operations are still well off in the future"
My understanding is that 60% of Chinese fertilizer production is from coal.
According to this 2004 paper from China, published by the International Fertilizer Industry Association,
That implies 10% or less of their production being from coal, if those plants are representative of the Chinese fertilizer industry.
"My understanding is that 60% of Chinese fertilizer production is from coal. - ...That implies 10% or less of their production being from coal..."
I got the 60% from here:
http://www.fertilizer.org/ifa/statistics/indicators/ind_reserves.asp
Look at the last line of the last paragraph of the energy section.
I think the 13% annual growth of solar seems quite low as well since its cost curve is even more favorable for sustained rapid growth than wind. If you think about it, the single 1.5 GW annual capacity plant going in in Singapore will account for 10% of your anticipated 2050 capacity, so you really need to end the growth of manufacturing capacity right away to keep the numbers down as much as you have. One would need a moratorium on new plant construction, such as is being considered for coal in the US, within the next few years to do what you anticipate. Perhaps you feel this is realistic, but right now a lot of heavy hitters are shifting energy investments towards solar including technologies that may still be a few years off. Perhaps a law that requires recently build manufacturing plants to shut down to make room for the newer technologies would be needed as well.
Regards,
Chris
I'm a total solar skeptic. Get back to me when annual solar generation breaks an exajoule, and I'll revisit my position.
Solar hot water heating is already three times that and growing at 14% per year. California is requiring that all new residential buildings and all new commercial buildings in the state shall be zero net energy by 2020 and 2030 respectively. Much of what remains after efficiencies in architecture will be handled by solar power.
Leaving realistic growth of wind and solar out of your model detracts from its value I think. You have had a number of folks suggest that you include ranges in you model. The current growth rates in wind and solar would be a reasonable center point while using the acceleration in growth might be a useful upper bound, or perhaps examples like the growth of German tank production in the late 1940s would provide a useful upper bound since this stressed existing economy wide manufacturing capacity. So, 100% annual growth might be a realistic limit.
Chris
"I'm a total solar skeptic. Get back to me when annual solar generation breaks an exajoule, and I'll revisit my position."
Well, with that perspective I can see why you're pessimistic!
Let me add to MDsolar's comment - California is requiring developers to offer PV on all new construction in 2011. I expect solar to be mandatory on all new construction at some point.
The manufacturing cost of solar cells has already dropped to $1.15/watt, which means that the retail price of roughly $8/watt is going to drop dramatically. PV electricity is going to be cheaper than utility pricing in the next 5 years, and then you'll really see dramatic growth in demand.
http://science.reddit.com/info/60ai4/comments/
please help us by spreading TOD work around as much as you can. thanks.
Paul,
This is an excellent essay, particularly your graph of likely nuclear expansion, or lack thereof. I have a couple of points:
1) You mention energy many times, but entropy and exergy not once. These are important concepts to be aware of, given that electricity will be a bigger part of the mix. For most applications, people need exergy, not energy. A windmill or PV panel produces "pure exergy", and can displace a larger quantity of energy for low-value uses, like heating buildings. We could live better lives (based on the usual technological measures ) with half the energy, if it is all electricity. There are also many electric-intensive green technologies waiting to replace "smokestack" industries, as soon as the price of carbon goes up relative to electric.
2) Your presentation gives the impression of "equal weight" to geothermal and tidal vs. solar and wind, and might mislead people into thinking they have equal chance of contributing a significant amount of our energy needs. Dr. Nate Lewis of Cal-Tech posted a good comparison on his page, showing the relative potential contribution of renewables, and is worth a browse. Solar is the *only* renewable with potential to scale to the required power, and (my opinion) should be subsidized to kick-start production. The others should be installed where viable, but without subsidies, as research funds will be increasingly scarce.
There are good reasons I don't mention exergy. First, I want this article to be at least semi-accessible to average citizens, and the explanation of exergy and why it's important would send most people screaming for the door. Second, I have yet to find any authoritative quantification of the exergy of many energy sources. That situation would leave me having to make assumptions, and doing that would result in the whole exercise being quibbled to death - around here, anyway.
I don't know where you get the impression that I hint at equal weight for tidal/geothermal and wind/solar. I explicitly project "other renewables" at only 1/15th the combined output of wind and solar in 2050. There isn't even an equal ,i>chance of them contributing the same projected amount because the extrapolation in the first case was linear and in the other case was curves (ignoring for the moment the debate about the types of curves I chose).
For anyone knowledgeable in coal mining, can coal be mined without using large quantities of oil? I see these giant draglines and huge dump trucks operating at open pit mines, using huge amounts of diesel fuel, and I just wonder when oil becomes a very scarce commodity, what happens to these operations. What about underground mines and the type of energy required to operate?
I am suspicious that as as one form of energy falls off, it will significantly effect our ability to acquire other forms.
I also point out that building the infrastructure for new coal mines requires a very large use of resources, not to mention the added rail and barge capacity needed to move it. Where are these resources coming from to build the infrastructure when resources are already scarce?
You're absolutely correct, of course. One of the things missing from this analysis is the myriad of cross-coupling links - not just to other energy forms, but to changing national economic situations as well.
A point of clarification may be in order here. This article is mainly intended to provide a baseline for each of the energy sources in isolation. I want to use this energy picture as the cornerstone for as series of articles that will investigate increasingly complex energy-related scenarios, from national GDP to regional and national food production changes, to geopolitical influences and finally ecological impacts. I suspect the picture is going to get a lot more constrained than this as the series unfolds.
The article is quite informative, particularly to demonstrate the inadequacy of alternatives. I am constantly amazed at the quality of the work presented on this site, and the personal energy that goes into it.
EROI for underground coal is pretty good. Most of the energy used underground is electricity, diesel exhaust is no fun to breathe. Diesel is used more for haul trucks and scrapers in the surface mines, though the big shovels are electric. Other energy intensive consumables are steel roof bolts, carbide bits, big tires, and machine parts. As far as oil use, more attention could be paid to how the workers get to/from the site, where they live, how their families get food, etc.. In the early days, coal miners' families lived walking distance from the pit.
There is also potential to revive coal-tar extraction technologies, such as Karrick Carbonization. This is most suitable for bituminous coal, and doesn't really affect the coal's usefulness for thermal uses. By "skimming" the lightest volatiles from thermal coal, a mine could produce enough to run the trucks. Its messy though. Supercritical CO2 might be a more modern way to do this.
"I see these giant draglines and huge dump trucks operating at open pit mines, using huge amounts of diesel fuel, and I just wonder when oil becomes a very scarce commodity, what happens to these operations."
A good question, and I for one don't have the answer. But it concerns more than just coal. Natural resources are usually either dispersed, or occur in locations distant from development. There's others in addition to mining. Agriculture and it's harvest are talked about, with many feeling that industry will receive preferential treatment. Not sure. Also there's timber, exceedingly dependent on FF for harvest and transport. Fisheries may revert to wind. You can't beat oil for putting a dynamo in the middle of nowhere.
We can produce plenty of diesel and gasoline from coal. But it takes at least one percent of the coal to pay for it. We only get 99% of the coal after we dedicate the use of some of it for synfuel plant feed.
Underground coal is routinely mined at very positive EROEIs using all electric machinery. On the surface, the mined coal is moved using diesel powered trucks but movement of cargo can be accomplished in other ways. The only reason strip mines are done as they are is that petroleum based strip mining has an even higher EROEI. When the cost of petroleum goes high enough, coal will be mined using electricity.
"The greatest shortcoming of the human race is our inability to understand the exponential function." -- Dr. Albert Bartlett
Into the Grey Zone
Predictions are hard especially about the future. I noticed a pre hoc decision to fit the data to a polynomial. At the same time, it is noticed that wind and solar are growing at 30% a year, which is to say exponentially.
Suppose windpower continues to double every three years. Then it will increase by 2^14 or 16,384 in the next 42 years. Or before 2050. From 50 tons today to 800,000 tons in 2050. Compare that to 1,000 tons projected for wind and 100,000 tons of peak energy use, presumeably due to supply constrainsts.
The story for solar is similar. Solar is also growing at 30% a year but there's a quarter as much solar than wind so there will always be a quarter as much solar.
RobertInTucson
I haven't escaped from reality. I have a daypass.
I know. I went round and round with Nick over this issue. Nick's comment on the offline discussion and its outcome is here:
http://www.theoildrum.com/node/3188#comment-261338
My response is here:
http://www.theoildrum.com/node/3188#comment-261921
I'm much happier not postulating a growth curve that ends up projecting a hundred times our total current energy supply in 40 years. I think my projection will be much closer to reality. If it's not, then in 2050 I will buy you and Nick each a $10,000 beer.
"I know. I went round and round with Nick over this issue. Nick's comment on the offline discussion and its outcome is here:"
Thanks. I've posted a response.
"I'm much happier not postulating a growth curve that ends up projecting a hundred times our total current energy supply in 40 years. I think my projection will be much closer to reality."
Well, of course it has to level off. It's just going to level off at a much higher point, earlier, than is shown by the polynomial, and that logistic/sigmoid function will be much closer to reality.
How do you come to this conclusion?
Hmm. That's a broad question. I take it you're asking why I thinkg wind/solar will grow very strongly.
Well, wind and solar are scalable, high E-ROI, manufacturing based with no significant long-term supply bottlenecks.
Sorry, I'll try to be more specific.
I've read your argument concerning wind/solar many times. What I'm not familiar with is how you've come to the conclusion they will level off at a much higher point than GG has come up with.
No, not really. Its obvious wind/solar are growing very very fast. But when they account to just a bump on the rounding error of total energy, that's not saying much.
"What I'm not familiar with is how you've come to the conclusion they will level off at a much higher point than GG has come up with."
Ah. Well, that's a big subject. Let's start with scalability in terms of basic resource.
Solar is scalable: the earth receives 100,000 terawatts continously from the sun, and humans use the equivalent of 4.5 terawatts on average (15 TW of BTU’s is the standard measurement. That’s equivalent to 1/3x as many electrical BTU's. For instance, in the US 39 quadrillion BTU's are used to produce 13 "quads" of electricity).
Wind's resource is about 72TW, average.
Wind in the US could generate twice the electricity we use now.
Here is an analysis for just one region, the Mid-Atlantic:
February 7, 2007
Mid-Atlantic Offshore Wind Potential: 330 GW
by Tracey Bryant
The wind resource off the Mid-Atlantic coast could supply the energy needs of nine states from Massachusetts to North Carolina, plus the District of Columbia -- with enough left over to support a 50 percent increase in future energy demand -- according to a study by researchers at the University of Delaware (UD) and Stanford University.
Willett Kempton, Richard Garvine and Amardeep Dhanju at the University of Delaware and Mark Jacobson and Cristina Archer at Stanford, found that the wind over the Middle Atlantic Bight, the aquatic region from Cape Cod, Mass., to Cape Hatteras, N.C., could produce 330 gigawatts of average electrical power if thousands of wind turbines were installed off the coast.
The estimated power supply from offshore wind substantially exceeds the region's current energy use -- which the scientists estimate at 185 gigawatts -- from electricity, gasoline, fuel oil and natural gas sources.
The study marks the first empirical analysis in the United States of a large-scale region's potential offshore wind-energy supply using a model that links geophysics with wind-electric technology -- and that defines where wind turbines at sea may be located in relation to water depth, geology and "exclusion zones" for bird flyways, shipping lanes and other uses.
Kempton, the UD professor of marine policy who led the study, has worked on several public opinion surveys about offshore wind power over the past three years, including a survey of Cape Cod residents, who largely have opposed a major wind farm proposed for their coastal area, and a more recent survey in Delaware that revealed strong support for offshore wind power as the next electricity source for the state.
"In doing our surveys and watching the public debate, we saw that no one had solid empirical data on the actual size of the offshore wind resource, and we felt this was important for policy decisions," Kempton said.
Estimating the wind power resource
The scientists examined current wind-turbine technologies to determine the depth of the water and the distance from shore the wind turbines could be located. They also defined "exclusion zones" where wind turbines could not be installed, such as major bird flyways, shipping lanes, chemical disposal sites, military restricted areas, borrow sites where sediments are removed for beach renourishment projects, and "visual space" from major tourist beaches.
To estimate the size of the wind power resource, the researchers needed to figure out the maximum number of wind turbines that could be erected and the region's average wind power. The spacing used between the hypothetical wind turbines was about one-half mile apart. At a closer spacing, Kempton said, upwind turbines will "steal" wind energy from downstream ones.
Anemometer readings from the nine NOAA weather buoys in the Middle Atlantic Bight were analyzed. To determine the average wind over the region, the scientists reviewed all the wind-speed data from the past 21 years from one of the buoys. The findings were then extrapolated to the height of the offshore wind turbines currently being manufactured in order to determine the average power output per unit.
At the current 80-meter (262-foot) wind turbine height, the extrapolated wind speed of the mid-range buoy is 8.2 meters per second (18.3 miles per hour or 16 knots).
The scientists' estimate of the full-resource, average wind power output of 330 gigawatts over the Middle Atlantic Bight is based on the installation of 166,720 wind turbines, each generating up to 5 megawatts of power. The wind turbines would be located at varying distances from shore, out to 100 meters of water depth, over an ocean area spanning more than 50,000 square miles, from Cape Cod to Cape Hatteras.
In comparison to the oil and natural gas resources of the Atlantic Outer Continental Shelf -- the submerged land that lies seaward from 3 miles offshore and is under federal jurisdiction -- the researchers found that the shelf's reported energy sources would amount to only one-tenth of the wind resource and would be exhausted in 20 years.
Addressing wind power fluctuations and energy priorities
While 330 gigawatts is the average output of the entire offshore wind resource over the Mid-Atlantic Bight, the researchers note that offshore wind is not uniform and offer suggestions for addressing power fluctuations.
"Over a large area like this, the wind blows stronger at some times and places, weaker at others," Kempton said.
To make wind power more uniform, the study shows that multiple sites could be connected through power lines to reduce the number of times of both maximum and minimum power. Changes in new and replacement energy-using devices, including automobiles, also could provide for greater power storage.
"Battery and plug-in hybrid automobiles, for example, have large storage that is unused when the car is parked," Kempton said.
With a scientifically reliable estimate of the region's offshore wind power potential now in hand, how likely are we to actually install more than 100,000 wind turbines off the Mid-Atlantic coast?
"Today, market forces and incremental technology developments will gradually make offshore wind the least-cost power in more and more East Coast locations," said Kempton. "On the other hand, if climate change becomes a much greater priority for the United States, our study shows how we could displace more than half the carbon dioxide emissions of the Mid-Atlantic area quickly, using existing technology."
On the practicality of producing 166,720 wind turbines, co-author Richard Garvine noted, "the United States began producing 2,000 warplanes per year in 1939 for World War II, increased production each year, and, by 1946, had sent 257,000 aircraft into service."
"We did that in seven years, using 1940s technology," he said.
Tracey Bryant is assistant director for research communications at the University of Delaware. This article was reprinted with permission from the University of Delaware.
Nick,
I didn't ask if the earth was a sunny and windy place. I asked you to explain why you think the curves for wind/solar will be so much steeper and higher than what GG has come up with.
I don't think it's a big question. I just want to know why you differ from GG.
No energy transition in the history of the human race has occurred with the speed and growth he postulates for as long as he postulates. The burden is on those making incredible (as in not believable) claims to verify those claims. No one, I repeat, no one, has demonstrated a plausible reason to believe that solar and wind will continue to grow at these rates for as long as he is postulating. Until Nick provides more proof that "because I think it is possible therefore it is" there is absolutely zero reason to believe such scenarios.
"The greatest shortcoming of the human race is our inability to understand the exponential function." -- Dr. Albert Bartlett
Into the Grey Zone
It doesn't seem plausible to me either. I figured I just must have missed a key part of Nick's argument in another thread.
I guess not.
Reminds me of his blind optimism towards PHEVs and EVs as well.
"I figured I just must have missed a key part of Nick's argument in another thread."
What, specifically, makes you skeptical?
Wind and solar have high E-ROI, cost competitiveness (though solar is still pricey: costs have plummeted but pricing is dictated by demand being ahead of supply), scalability, no significant supply bottlenecks, and extremely high growth rates.
Wind is 1% of US electrical demand, and was 20% of new generating capacity installed in 2006. New capacity in 2007 has grown 60%.
See my nearby comment for more evidence. Is there anything at all, specifically, to support your skepticism?
"Reminds me of his blind optimism towards PHEVs and EVs as well."
Yes, we had a similar discussion before. I provided a great deal of evidence, and skeptics provided essentially none. In that way, it's very reminiscent.
"No energy transition in the history of the human race has occurred with the speed and growth he postulates for as long as he postulates. "
Not so fast.
1st, I think you overestimate my claims. Wind/solar only have to grow at current rates for about 7-8 years, and then grow at substantially lower rates, to satisfy any demand there might be for electricity.
2nd, I think if you look at several periods in the history of oil, such as 1865 - 1890, or 1910-1930, or 1949-1972, you'll see some pretty impressive growth rates.
Also, nuclear showed comparable growth rates for a long period.
"The burden is on those making incredible (as in not believable) claims to verify those claims. "
GG is the first to present claims here, and certainly bears some burden of proof - he hasn't given any evidence for his assumption of much lower growth for wind/solar during a period when he expects a serious energy supply deficit. OTOH, I can indeed present a great deal of evidence, starting with my answer on growth rates above. GG's evidence? His intuition, which he calls a "sniff test"!
No energy transition in the history of the human race has occurred with the speed and growth he postulates for as long as he postulates.
My impression is that Norwegian, Swiss and Icelandic development of hydroelectricity did have comparable growth curves to what he postulated. A bit slower (WW II created a pause), but a large scale, long term effort none the less.
It would be interesting to review British coal consumption in the early days of the Industrial Revolution.
Best Hopes for Sustained Growth of Renewables,
Alan
The simple answer is that GG used a 3rd order polynomial equation provided by excel that gives much lower growth rates in later years than the exponential (or logistic) equation that I use.
Both wind and solar have been growing exponentially for quite some time (including well before the data period that GG used, and for which an exponential fits and a polynomial fails completely),and there's every reason to think that they will continue to do so.
I pointed out to GG that a two term exponential equation fit better than the 3 term, 2nd order polynomial he started with, and he tweaked the equation by adding a fourth, 3rd order term! This is clearly an artificial equation (you can always get a polynomial to fit anything if you add enough terms).
GG doesn't want to use an exponential (or logistic) because his intuition tells him that wind/solar will fail to continue anything close to their current growth rates, though he can't articulate why, or provide specific evidence - he just can't believe it.
Thanks, I understand your point better now.
This seems to me to be obvious. Nothing sustains such large exponential growth for long. That, in my opinion, is not an extraordinary claim.
Lots of immature markets show large exponential growth at first. Since wind/solar are such a miniscule part of the energy market, it takes only a tiny investment to sustain such growth.
To claim wind/solar will continue large exponential growth for decades to come is an extraordinary claim.
Basically you see no limits on wind/solar growth. That's hard to swallow.
When you consider all the parrell development needed along side wind/solar: HVDC grid, pump storage, replacement of ICE fleet, battery tech etc, and on a world wide scale it becomes even harder to imagine.
Exponential growth is a killer. Its impossible to sustain long term in the real world.
"Lots of immature markets show large exponential growth at first. Since wind/solar are such a miniscule part of the energy market, it takes only a tiny investment to sustain such growth."
Wind and solar are each roughly $15 billion markets. That's not tiny.
"To claim wind/solar will continue large exponential growth for decades to come is an extraordinary claim.
Basically you see no limits on wind/solar growth. That's hard to swallow."
I'm not suggesting that it will continue for decades. I would suggest that it will continue for about 7-8 years at such rates, and fall as demand is satisfied. Demand will depend largely on how quickly we want to retire coal plants.
"When you consider all the parrell development needed along side wind/solar: HVDC grid, pump storage, replacement of ICE fleet, battery tech etc, and on a world wide scale it becomes even harder to imagine."
Ah, good, now we have some specific objections.
"HVDC grid"
Costs about $.25 per watt. Not too bad, but it will take some time to build. Not much will be needed (just projects like those in progress int TX and CA, to get wind to markets) until wind gets to about 20% market share, at which time geographic diversity will become more important.
"pump storage"
Again, not needed now. We have decades to build it.
"replacement of ICE fleet"
That will start about 2009, with the first PHEV's, and will take roughly 15-25 years, depending on our commitment. Vehicles less than 6 years old account for 50% of miles driven, so it's less than you might think. Hybrids are 2% of new light vehicles in the US, and growing about 50% per year. Take a look at www.gm-volt.com .
"battery tech"
That's here, though it will get cheaper, and that will allow the gradual expansion of batteries in PHEV's. Take a look at A123systems and Firefly batteries.
I don't have time for great detail right now, but I hope that will do for a first round. Anybody else want to provide responses?
Around and around we go.
Nick, you must live in a wonderful place. A world where any and all challenges can be wiped away with a positive outlook on life.
Replace the ICE fleet? No problem. Hybrids make up a minuscule fraction of the new car market in the US. Problem solved.
Batter tech? Piece of cake. We have some non-commercialized incredibly expensive batteries. Free batteries for everyone!
New power grid? Here ya go, pennies on the dollar.
Wind and solar an immature market? Heck no, they're huge! Who cares if they don't even show up but as a rounding error on total energy usage.
Massive unrestrained exponential growth in a time of declining resources? I think I can, I think I can...
Nick, you don't provide a lot of evidence. You show your dream to others and are flabbergasted they don't believe along side you. Geez man, how many times can you link that GM-volt blog like its some sort of proof of your dream. Like none of us have every seen it before. All you have to do is get us to see it and realization will dawn on our ignorant little minds.
Its not that I don't want you to be correct. But my experience tells me to take extraordinary claims with a grain of salt. But you seem to have no problem swallowing anything.
Rethin, could you make your objections a little more specific? Quantitative??
ok, details:
"Hybrids make up a minuscule fraction of the new car market in the US. "
No, they're 2%, and doubling about every 2 years. That would have astonished anyone predicting 5 or 10 years ago. They're very likely to be 50% in 10 years. Further, they'll be mostly plug-in.
"We have some non-commercialized incredibly expensive batteries. "
No, A123systems is commercialized - take a look at DeWalt tools, and not especially expensive, given their cycle life. Firefly isn't commercialized quite yet, but they look extremely likely, and very cheap. But heck, lead-acid is already cheaper than gasoline.
"Wind and solar an immature market? Heck no, they're huge! Who cares if they don't even show up but as a rounding error on total energy usage."
1% of electricity, and doubling every 2 years, is much more than that. If you disagree, please show your numbers.
"Massive unrestrained exponential growth in a time of declining resources? "
Which resources? Oil? Sure. A high E-roi energy source will attract investment faster than anything else. The scale of production needed is perhaps 5% of the US manufacturing base. Disagree? Again, please do some calculations.
" Geez man, how many times can you link that GM-volt blog like its some sort of proof of your dream."
Well, it's seems pretty clear to me. If you disagree, why not say why, specifically?
"my experience tells me to take extraordinary claims with a grain of salt."
Sure, but nothing I'm saying is extraordinary. Even if it is, I've provided a fair amount of info. If you disagree, please be specific, and quantitative...
Its hard to be more specific than you have already been Nick.
I'll let that stand own its own. 2% of new US sales. Oh and BTW, 10 years ago you could buy an all electric car from one of the big three. I bet they'd be shocked today, shocked at the slow pace of progress.
1%, got it. No disagreement here.
Drill batteries. I guess that's better than nothing.
That explains why the market is flooded with lead acid EVs at the moment.
And in china the price of eggs is 1.99 a dozen. Its a meaninless statistic. You can justify anything with numbers like that. Want a man on mars? 2% of US manufacturing base. A colony on pluto? 78%. See how easy that is.
I think both of us are looking at the exact same data and are coming away with vastly different opinions. I think I'm being reasonable, and I know you think you're being reasonable.
But I just don't think its reasonable to take early exponential growth and extrapolate it indefinetly into the future. In the real world there are limits to growth. Complex systems behave in unexpected (and most often unexpected limiting) ways. Progress follows a creaming curve, with the easiest gains make the earliest.
I'm not sure why you believe wind/solar are exempt from this.
I have to say I find Nicks arguents much more convincing. Although wind power hasn't been doubling every two years, it's slightly more than three years. Fast enough though. Nuclear had average production growth of 36.5% when going from 1.7 TWh to 273 TWh over 20 years. I don't see why wind and solar could not do the same and keep going after that. Nuclear had some problems with bad publicity at that point.
Some fundamentals for wind and solar: huge resource base, advancing technologies, wind partly in the competitive range, higher future costs for fossil fuels due to GHG mitigation and scarce resources. From these I deduct nearly exponential growth for these renewables until they start to dominate the new power capacity markets - and they are not too far from that in Europe and US.
I don't think wind will have any large barriers around 20% energy penetration. It can go up to 40-50% in reasonably sized power system before there starts to be disturbing amount of moments when wind production is higher than electricity consumption. 40-50% penetration will certainly favor more intermediate and peak load plants over baseload plants. It's possible to go beyond that, since one can shed wind if there's too much production, it just starts to hurt the economics more and more. At that point it would be nice to have more flexibility from unconventional sources in the power system. Well, they could be useful before that if they can provide the flexibility cheaper than conventional units.
Sure, Nukes had large growth when they were ramping up from nothing. This is no suprise. Large exponential growth is quite common for young industries. But Nuke growth backed off as the industry grew. I expect the same for wind/solar. Even after such spectular growth Nukes only account for 6% of our energy mix.
I thought I made this point clear above. Either you didn't read my posts or my writing is much worse than I suspect.
I never claimed wind/solar aren't growing exponentially. I only scoffed at the idea it can go on for an extended period of time.
The simple problem of intermitcy will cap wind/solar long before it dominates power markets. I'm sure they'll make up a good part of new power for a few years. But like I said, early growth is the easy growth.
BTW, you mention Europe and the US. Is the rest of the world just going to freeze in the dark?
I'm not sure where you are getting this. Its often quoted that the grid in its current form can't handle more than 20% wind/solar.
Well, you are conveniently ignoring that nuclear run into problems like Three Mile Island at that point. I don't see something like that happening with wind or solar.
Wind power is picking up very strongly at China and India as well. They just have smaller base and it takes a while before they catch up. China is actually seeing really nice growth in wind power, although it is shadowed by new coal power. Also, for the current discussion, Chinese coal has had some very impressive growth numbers. Now it's starting to be limited by the fact that demand is mostly being met in China, which was not the case few years back. It serves to demonstrate that building power capacity fast is very much possible.
That quote is wrong. I think that it has come up from the fact that almost all wind integration studies made so far have only looked at wind penetrations up to 20% (see new state-of-the-art report). However, those studies don't claim that it is somehow impossible to go above 20%. People just have assumed it, since they haven't seen studies with higher penetrations. When going to higher penetrations, wind integration costs increase somewhat, but there is no reason why the power system could not handle more wind. Wind variations in large area don't happen fast and prediction errors are reasonable. Rest of the power system can cope with more variation with relatively small changes into the system. There needs to be more regulating power (which is provided by units that are in the system already, they just need to participate in the regulation market more) and some parts of grid would need enforcements at some point, which naturally depend on the system in question.
I see. So you believe there are no constraints to wind/solar growth?
I wish people had a better understanding of the exponential growth curve. It is, by its very nature, unsustainable in the real world.
The questions regarding wind/solar are: what exactly are these restraints and at what point do they impact the growth curve?
GG has gone to great lengths to explain where he thinks the limits kick in.
Nick seems to believe solar/wind will continue its large exponential growth for an indefinite period of time (or at least long enough to replace declining FFs).
I'm still waiting for Nick to define his curve and what limits (if any) await wind/solar.
My point above is expecting exponential growth to slow after a short initial growth spurt is the default case. It is seen everywhere in the real world.
To expect exponential growth (of any system) for and extended period of time is an extraordinary claim and demands extraordinary proof.
So go ahead and postulate extraordinary growth for wind and solar if it helps you sleep better at night. But if you are going to insist on that to me you're going to need extraordinary proof. (And no, the earth is a windy sunny place is not extraordinary proof).
Nobody is saying that nearly exponential growth will continue forever. A passage from my earlier comment: "...until they start to dominate the new power capacity markets".
So, my take is that constraint comes when installed new power capacity is getting mostly filled by these new renewables. However, even with exponential growth, it will take 15-20 years before we hit that point. And certainly there will be places where other forms of power will be built. These are capital intensive forms of power and in many places interest rates are too high and long term investments too risky. Lot of Africa runs on diesel generators for that reason. Also it's unclear to me whether we will find enough ways to mitigate the variability of these sources to get rid of nearly all coal and natural gas electricity production. I'd like to see us do that with smarter grids, larger grids, plug-in electric vehicles, heating/cooling side flexibility (easier to store than electricity) and to some extent with electricity storages, but as it stands now, using conventional power plants is mostly cheaper.
GG is saying that the limit to wind is in the variability. I say that this limit is not as constraining that people usually think and I've tried to explain some issues around it. This limit doesn't show up in GG's graph for wind development until 2050, because he's using the polynomial fit for growth, which in his opinion is better in predicting growth. Many have strongly argued against it, since growth seems to be more exponential, if there is no limits working against it. To me it makes more intuitive sense as well. Manufacturing companies like to see double digit growth rates year after year, they don't aim for decreasing growth figures (which takes place in his polynomial fit). If a company has a large market in front of it, other companies will take market share if the company doesn't grow as fast as it could. Limits will certainly come, but we'll continue to see nearly exponential growth until then.
I don't think variability is "the" limit to wind growth. I think it's "a" limit. Others will include manufacturing capacity, installation capacity (an often overlooked constraint), site availability due to public opposition, regulatory and approval delays (which is another sort of capacity issue), increasing maintenance requirements of the installed base as it ages (yet another capacity issue), constrained capex in the third world, etc.
If an exponential fit is better for the early stages, but proponents admit it can't last long and the curve will change even ever the short term, I'm not so sure what all the hoo-hah is about. would you all feel better if I said it would be exponential for the next 5 years, then switched to some arbitrary lower-growth regime based on the constraints I outline above? How would that be any better than what I've done?
Well, let's address some of these in a preliminary way.
Variability: As has been noted by mdsolar, wind variability isn't a big problem below 20%. Solar will be able to grow to at least 20% as well, so that's a combined market share of 40%. I actually don't think we'll need wind & solar to go much above 40% in the next 30 years, unless we choose to reduce coal usage sharply. In that case, the straightforward solution is to keep coal plants for backup, and sharply reduce their % utilization.
Although retaining coal as a backup is sufficient, there are other solutions as well. PHEV's will soak up a great deal of variance. Pumped storage, long distance transmssion will reduce variability - they're large capital projects, but heck, we have decades in this scenario.
Manufacturing capacity: wind costs about $1.50 per watt and falling, solar $1.15 and falling fast, for an average of $1.33. In the US, electrical demand grows by about 1.8% per year. If we start to electrify transportation, this might rise to 3%. Wind/solar needed new capacity to satisfy this would be about 3% of 440GW average, or about 13.2GW. At 24% capacity factor (an average of 18% for solar and 30% for wind) we'd need about 55GW of capacity, which would involve production of about $73B per year. That's only about 15% of our car manufacturing per year. IOW, it would be easy to build that much.
Installation capacity: Wind and solar installation aren't especially highly skilled jobs. This might easily be a limit in a 2-5 year timeframe, but in a 43 year time frame??
Site availability due to public opposition: For wind, this is a non-issue of esthetics. First, there's plenty of rural and off-shore sites - even now NIMBY is really not a big problem, despite a few highly visible sites like Cape Wind. 2nd, it's not an issue for solar at all. 3rd, in a world where energy was desperately needed, no one would allow this to get in the way.
Regulatory and approval delays: are not a real problem for wind or solar, even now. As with NIMBY, if we desperately need power, this will be even clearer.
Increasing maintenance requirements of the installed base as it ages: wind has some moving parts, but maintenance isn’t a large cost - less than 1% of revenue, even at current low electricity costs. Again, this technology isn't that complex, or hard to do right.
constrained capex in the third world: that could be a real problem. OTOH, as solar gets very cheap, it will be more affordable than oil is now. It certainly is for lighting in Africa.
"would you all feel better if I said it would be exponential for the next 5 years, then switched to some arbitrary lower-growth regime based on the constraints I outline above?"
That would be fine. Careful analysis of the constraints discussed above will clarify that wind/solar will grow to the point of meeting demand, whatever that is. Your overall energy curve will flatten out, and probably grow, though the greater efficiency of electricity (between 4:1 and 6:1 for light vehicles) may make that unnecessary.
I guess that I'd just add that leap-frogging fossil fuels has some reduced cost aspects. In intial electrification using fossil fuels you need either transmission lines or roadways to carry fuel to generators. But, many of the applications are not critically dependent on a constant on power source. Water pumping and refridgeration for medicine can both be handled, and often are, with only periodic power supply. The power output per unit weight of a solar panel is much higher than for fossil fuels so that much less road maintenance is needed to distribute electricity this way. And, for low utilization transmission lines, there can also be some savings. Solar with storage generally makes sense in the US if you need to string about 10 miles of transmission as your alternative. For systems with less storage, the distance would be shorter. Because electrification has such beneficial effects, especially right at the outset, the capital expense may well be handled locally through microcredit mechanisms. So, one does not look at the $2/day budget but rather at the increased budget that electrification brings. The current shortage of silicon (which raises prices) and a shift away from production of low wattage modules appears to be slowing solar adoption in underdeveloped countries. I expect the 1.5 GW manufacturing plant in Singapore with reverse this trend.
Chris
"I'd just add that leap-frogging fossil fuels has some reduced cost aspects."
Sure. It's just like cell phones.
In a way, yes. Cell towers are actually building a fossil fuel grid in some places but you don't need to string the communications lines. But the incremental benefit from electrification would seem to me to be larger.
Chris
I'm sorry if I mispresented your views on limits. I was just reading what you had in the actual post. Anyway, I see a difference between the possible limit caused by variability and most other limits that you described in your comment. Variability could impose limits on the final share of wind in the energy mix, whereas the other limitations would affect the growth rate. Now some of us are arguing that manufacturing (and installation for that matter) can grow exponentially until limits of new capacity additions start to apply. Increasing maintenance is the same: if there's a demand for it, there will be people to do the work. I don't think we'll need very much different amount of engineers and technicians to work with a power system with lot of wind and solar than we need in a conventional power system. In fact, I think wind power needs less work force once it's up there compared to conventional power plants.
Regulatory and approval delays are part of the current exponential growth as well and I don't see why they would be a considerably bigger issue when wind or solar are big. One has to remember that there won't be thousands of wind parks being built at one region at any one time. It will be dispersed, which means that there will be more places that will do regulatory work related to wind power, but none of them has to deal with hundreds of applications at one time. On national level it takes time to establish the procedures, but once they are there the process is more smooth. Also, if there starts to be long queues somewhere, there will be pressure to get more people to work or make the process simpler. It's a question about investing billions of dollars, investors won't sit idle if they face regulatory delays.
Site availability is a local issue and will constraint installations at some areas. Unless there are other areas available in the same grid and unless it is too expensive or difficult to import wind from nearby regions, then this will limit the penetration of wind at that locality. However, I see this more as a restriction on final amount of wind, it won't impede growth, since globally there will be enough sites to put those turbines that result from nearly exponential growth, until demand limits start to apply. Most regions in the world have enough either own wind resources or neighboring regions with large resources so that siting won't be a major issue. There will certainly be problems in places where best wind sites are close to where people live, but usually in these cases there are bit worse wind sites in more remote locations, which still are close enough for transmission.
The hoo-hah is about the fact that your estimates for global energy would look very different if you had 15 years of exponential growth for wind and 20 years for solar (approximately, depends on your growth % assumption, new power capacity demand limits and final limits). Sigmoid curve would be much better, as I believe you agreed, but decided not to use because of not liking to guess the parameters for it. In my opinion, you are making just as large assumption when you decide to use a polynomial curve.
Somehow I think it's much more likely that we'll invest enough in energy production to keep using lot of energy (and grow in some regions) rather than keep on a polynomial growth track. Why I think it's wind and solar that'll take the large chunk is due to the fundamentals I mentioned before. It could also be that those fundamentals change or that I have misjudged them and we'll end up with more of something else, for example nuclear or coal with CCS. Although coal can't be long term solution due to resource constraints and nuclear only if some formidable problems are solved.
Hi John,
I think the 40% figure in the abstract might apply to 40% of installed wind capacity rather than 40% of total generating capacity. What do you think?
I think that a fully renewbale grid will appear, in some ways, to have excess capacity: generation that might be turned off just as we now turn off fuel based generation. But, I think our use of electricity will change to match that spare capacity. Right now we speak of pumped storage, and this might continue to have a place for a while, but there are good reasons to handle flood control differently so I think with a large excess of wind capacity in the Spring, we might tend to draw a season's worth of irrigation water out of Spring runoff waters and hold it in ponds for the growing season. Without doing this, much of western agriculture in the US will end as the aquifers deplete.
We tend to think of industrial processes being scheduled to run 24/7 to get payback on investment in equipment as soon as possible. But wear and tear comes from use, so the actual payback is somewhat independent of the rate of use. Industrial processes that run on fossil fuels today may be scheduled to use power when it is not being used by anyone else. This is already occuring in response to price in demand response programs for traditionally electricity based industries.
A grid that is built to handle peak essential demand also has the possibility of concentrating enourmous power. I would not be too surprised the see things like launch to orbit being assisted with electric power if it were available in such a manner. Rail guns are currently achieving ranges near 300 miles using electric power only. In fact, I think that a renewable grid pushes us towards compliance with our obligations under the nuclear non-proliferation treaty to disarm since distributed generation would be so robust against attack and could allow, almost require, a strictly homeland based defense posture since the means of eliminating a fleet, a missle attack, or an air force without engagement and at low cost would be available. I think we would only send out expeditionary forces in cooperation with other similarly armed powers since they would be so vunerable to very long range artillery without such cooperation.
So, the "over capacity" associated with a fully renewable grid will likely not be be left unused and has the potential to vastly reshape our geopolitical tactics.
Chris
The 40% in the abstract of the wind integration report refers to something different. I'll try to explain the terminology below. The abstract also mentions 20% wind penetration in relation to gross electricity demand. And it doesn't claim that one couldn't go above 20%. The report says that it's unclear what will happen (although the report presents a study from Danish TSO that has a 100% wind penetration, but it wasn't a fully fledged integration study; p. 36). Read also the last paragraph of the conclusion chapter; p. 110.
Usually wind penetration is measured as energy penetration: how big share of the electricity production comes from wind power. Sometimes people refer to capacity share of wind from peak load (nominal wind power capacity divided by peak load). This is often used when assessing capacity credit of wind power. These are the two measures for wind penetration that are in common use.
That 40% number in the abstract refers to capacity credit and not to penetration. It tells you that 100 MW of wind power capacity would be able to fully replace 40 MW of conventional capacity while keeping the same level of system security. 40% is a very high number in this regard (remember that the energy contribution from wind is only 25-30% compared to it's nominal capacity, so with 40% capacity credit wind is able to replace more capacity than energy in the power system). This high number is due to very good match between hours of highest consumption and wind power production (it's actually from offshore New York, onshore New York had much lower capacity credit: 5%).
I also believe that we'll see much more flexibility from the future power (or actually energy) system - especially when we'll start to rely more on the truly long-term options of wind and solar, which have variability issues. There are some locations where the winds are quite steady all year round and these sites could be very interesting for some industrial plants, comparative advantage. These include at least South Argentina and regions around Sahara. Concentrating solar thermal power can also be very interesting for industrial plants.
I wouldn't be so sure how big part wear and tear play in the balance sheet of industrial companies, I'd assume that capital costs are more important and therefore they'd like to run as much as they can. That said, there are some industrial processes that can store intermediate products for a while and have a low capital cost for the energy intensive parts of the process that happen before the possible storage phase.
John,
Thanks. I'm a little familiar with capacity factors but was not really understanding the abstract there.
I agree that current financing models urge rapid return on investment rather than looking at overall return. We are anxious if anything is left idle. But, there may be sectors where using wind power that might be thrown away otherwise would make sense, and these sectors will likely emerge as the opportunity arises. It seems like a balance between having a windmill in place and not using it our having something else in place and not using it when the windmill is otherwise employed. Perhaps I should be less anxious about both and say both could be left idle at times. This is certainly what one wants in security matters. The perfect police force does nothing but drink coffee in a Crown Victoria because no one is speeding and there are no accidents. The perfect army spends its time in training not in combat because no one dares attack. There should be room for plenty of spare capacity in a renewable grid.
Chris
"10 years ago you could buy an all electric car from one of the big three."
Actually, no. You could lease one of 800 experimental vehicles.
"I bet they'd be shocked today, shocked at the slow pace of progress."
Ummm...you're joking, right?
"1%, got it. No disagreement here."
And, that's a lot. The US has about 15GW of capacity now, and requests for ISO interconnection for 125GW! Wind is here.
"That explains why the market is flooded with lead acid EVs at the moment."
Well, actually there are an enormous number of lead acid vehicles in service now, just not on the highway.
Further, lead-acid is cheaper than gasoline when gasoline goes over $1.75/gallon. How long has gas been at that price? More importantly, I raise that just to address your skepticism. PHEV/EV manufacturers won't use it because there are better batteries available.
"The scale of production needed is perhaps 5% of the US manufacturing base. - And in china the price of eggs is 1.99 a dozen. Its a meaninless statistic. "
Not if you're addressing an objection about availability and scalability of manufacturing.
"But I just don't think its reasonable to take early exponential growth and extrapolate it indefinetly into the future. "
I'm not. I'm sure wind and solar will slow down in about 20 years, as demand begins to be satisfied. OTOH, they won't slow down to the 7% per year specified in GG's scenario if there's a desperate shortage of energy, or urgent demand to replace coal.
"Progress follows a creaming curve, with the easiest gains make the earliest."
Except that in manufacturing, especially for reasonably new products, there is a very strong economy of scale: things get cheaper, as volume expands. That expands your market. That will happen in the next 5 years, as PV gets cheaper than utility rates. Then, watch out: it will be like standing near an early oil gusher.
Nick, for the love of god, this whole discussion is pointless until you tell us just exactly what growth rate you forsee.
hmmm. I think wind will grow in the US at about 50%, for about 5 years, then begin to drop as demand is satisfied. I think it will grow about 20% worldwide for about 15 years.
I think solar will grow about 50% per year (US & worldwide), for very roughly 12 years.
Both of these might extend these growth rates longer, if we're ready to reduce coal & gas usage, and even retire coal plants.
Wind was 20% of new US generating capacity in 2006, and 2007 new wind capacity is 60% higher than 2006.
US electrical demand grows by about 1.8% per year. If we start to electrify transportation, this might rise to 3%. Wind needed new capacity to satisfy this would be about 3% of 440GW average, or about 13.2GW. At 30% capacity factor we'd need about 44GW of capacity.
Wind could supply this much new capacity in about 7 years, and start replacing gas and coal after that.
Nick,
You can play with GG's spreadsheet yourself. But I plugged in your wind growth of 20% for 15 years (leaving everything else as he presented it). Even at that growth rate for a decade and a half, wind would only be 7.7% of world energy mix in 2022.
Doing the same with solar and your growth rates gets you 4.4% in 2019.
Both of them together barely register as a blip on the per capita energy graph and pushes back peak total energy by less than 10 years.
hmmm. Yes, I'll have to play with it - I don't have the time right now. Those growth estimates were rough and based on memory, and as I think about it, too low in the short term for wind, as IIRC current growth rates are 30%, and that's not going to slow down anytime soon - I was misremembering current world growth rates.
The growth estimates were based on the premise that the limits to growth for wind & solar are much higher than the amounts we're talking about here, and that they will grow sufficiently to satisfy demand. Really, I can't see any reasonable basis for a limit to growth other than the main one we have right now: institutional resistance from industries whose members would be hurt. Of course, that's no small problem, but I think that a good supply shock (like we're beginning to experience....) will be more than sufficient to sweep that away. Concerns about climate change will also help: I suspect that our response to CC will greatly accelerate mitigation of PO, as the rate of decrease in FF consumption needed for CC is much higher than is needed for CC. I'm not optimistic about the adequacy of our response to CC, but I think it will collaterally largely solve PO.
I would anticipate that growth would slow down at the point of reaching 20% of KWH, for each of wind & solar, unless public policy is willing to pay a premium to reduce coal utilization, in which case each might go to 35%. I would suspect that if they were insufficient at 20% that the optimal economic mix would include greater nuclear growth than the BAU projection. I’m not enthusiastic about nuclear due to proliferation concerns (I suspect that’s the root cause of nuclear opposition for many people, especially in Europe), but I suspect a good supply shock would sweep away that concern as well, for most people.
The next step is to plug in current growth rates, and see at what point they get to that point, and see how the curve changes if you hold them to that %. At that point you could start playing with the market % limits, as well as with nuclear growth rates.
Of course, this is an exercise in optimization: any of these 3 sources could grow to 50% market share with a premium that would be very, very low compared to the cost of inadequate energy supply - the experience of France is instructive regarding overbuilding of a single source.
Another TOD'er posted a link to a fascinating presentation. Take a look, especially at the discussion of wind turbine auto-correlation, and seasonal ratios. I think it becomes clear that intermittency and seasonal variation aren't serious problems for wind and solar, in a synergistic combination in a decently large grid.
http://www.iset.uni-kassel.de/abt/w3-w/folien/magdeb030901/
Nick,
30% growth for 15 years gives you 17% by 2022. But such growth is ridiculous. Look at the curve, its damn near verticle by 2020!
At that growth rate wind goes from 10% in 2020 to 17% in 2022. By 2025 wind would be by far the largest source of energy dwarfing oil, gas and coal.
30% exponential growth is a doubling time of 2.3 years. You expect the world to manufacture and install wind at such a tremendous rate for a decade and a half?!?
Even simple capacity lag will stall growth long before wind makes even a minor impact in total energy use.
Take some time and play around with GG's xls. Plug in these growth rates and see for yourself how reasonable they are.
I'm not sure how much longer this thread will stay open. But if you'd like to continue the conversation you can always email me at rethin@yahoo.com
Wow, I can't get over how great a tool GG's spreadsheet is. Thanks GG!
Peak total energy-wind/solar is in 2017 at 12,030 MTOE. To keep this level steady to 2050 wind/solar* have to grow at and average 8% per year for 33 years. For comparison total energy (coal, oil, gas, nukes etc) grew an average of about 1.5% per year from 1965 to 2006.
It would have to grow faster to keep world per cap energy use steady.
But you can't expect world per cap energy to stay level if countries like India and China keep industrializing (and that seems to be a reasonable assumption).
This page shows Europe's per capita energy usage at 3.8toe and the US at 7.9. This compares to 1.6 for the world average.
You can see where this is going. If in 2050 per capita energy use was 3, the world energy demand would be 27,000 MTOE. FF's + nuke + hydro would have fallen to 6,500 leaving a shortfall of 20,500 MTOE to be made up with solar/wind.
Now elec is a better form of energy than oil or coal. I'm not sure what a good conversion factor would be, but lets fudge it and say elec is 3x more useful than oil. We'd then need 6,800 of solar/wind in 2050. To get that we'd need 8-10% growth per year for 33 years.* Or about 6x the growth in oil from 1985 to 2005.
Mind you this is for generation only. Our society, infrastrucure, economy etc would have to be transformed in parallel and at a similar rate. Is such a transformation likely? Is it even possible?
(*my model has wind and solar at 366 and 79 in 2016 (this represents a stupendous growth rate in the near term) and holds this 80/20 ratio through 2050.)
You're welcome :-) I'm glad you find it helpful.
I'm nowhere near finished mining that thing for info - I'm preparing a comparison worksheet for it that puts the GDP projections based on Ayres' work side by side with projections based on national energy intensity changes. That will give a useful second look at the economic conclusions, and might be worth a small follow-up article.
I redid that 3x elect vs oil factor a bit.
I plugged it into the spreadsheet that solar/wind would only have to make up 33% of the decline in oil and coal. I figure your ICE is 25% effecient while your electric motor is closer to 90%. And a coal elec plant runs at about 30% effeciency.
That means after the total energy peak solar/wind have to grow at 6.7% a year. A little better than the previous numbers.
That gives us in 2050 a total energy of 10803 MTOE but that 10803 does roughly the same amount of work as the 12030 in 2017.
The source I used above for per capita energy predicts a world percapita of 2.1 in 2030. I'll be cautious and postulate a per capita energy use of 2.0 in 2050. That's 17991 MTOE. Solar/wind would need to generate yet another 8000 MTOE a year to feed a growing world. The steady state model above has wind/solar at 4,339 in 2050. To supply a world with a per capita of 2.1 in 2050 wind/solar would need to be triple that.
So after 2017 solar and wind will need to sustain a growth rate of over 10% per year for 33 years.
Are these growth rates even plausible?
Keep in mind that all the energy sources have been converted by BP to Mtoe. If BP's analysts did their work properly, than the exergy content of different sources will have been normalized (at least to some degree). That would mean you don't need to take the efficiency differences into account, that's already been done. Nick figures the BP calculations are off, but I'm not enough of an energy boffin yet to say for sure. So for now I'm content to let Mtoe=Mtoe=Mtoe.
If that's true, then the situation just got worse than you calculated - I think you'd need to stay at 12000 Mtoe to keep the Red Queen happy. And no, I don't think 10% growth rates for 33 years are plausible for an (advanced)nano-second.
I see that now, but BP only did that for Hydro and Nukes. You got your solar/wind data from other sources.
If your solar/wind numbers weren't equvilant than 1MTOE of solar/wind should roughly offset 3MTOE of coal (in a coal fired elec plant) or petroleum (burned in a therm elec plant or ICE).
If they are equivilant than yeah, the situation just go 3x worse.
I used the same conversion ratio for solar/wind as BP did for hydro/nuke, 4.42 TWh = 1 Mtoe. You can see that in the "Solar" worksheet in the top cells of column E, and in the "Renewables" worksheet in rows 246 and 247.
Thanks.
GG,
The Excel version that's on your website has a mistake, if I get it right. Look at the sheet 'Energy Consumption Model'. Check the column 'Total'. It sums up the whole row from 'Oil' to 'Other renewables'. Column D is a sum of oil and gas. Oil and gas are therefore summed twice in the total figure. This doesn't probably change most of your graphs, but at least the pie charts don't add up to 100%.
Oops, I see now that the charts on the Oildrum are correct. Maybe it's just an old version of the Excel file that's on the web.
" I don't think 10% growth rates for 33 years are plausible for an (advanced)nano-second."
Have you looked at the growth rates for oil, from 1859 to 1972?
You'll find multi-decade periods where oil grew at comparable rates. During the overall time, where growth stopped, it was because demand was satisfied, not due to growth limits (in fact, surplus was the primary problem during the whole history of oil, up until the last few years).
Similarly, the problem with electrification won't be the supply of electricity, it will be in demand,, i.e., conversion of end-users to electricity. That won't be a problem for vehicles in the OECD, as they have such fast turnover (effectively a median life of 6 years), but it will be a problem for housing in the OECD (less in the US, more in Europe, where housing is older), and for both transport and housing in developing countries (though perhaps more for transport, as much housing doesn't have HVAC).
So, demand may have trouble growing that fast...
There isn't an energy problem, there's an oil & gas problem.
Even given some tremendous growth rates in the next decade (multiple years of solar at 50% and wind at 30%) wind and solar combined will only be 445 MTOE in 2017. Total Energy in 2017 will be 12030.
If world per capita energy is 2.0 in 2050 (a very conservative estimate) total energy will be 17991 MTOE. But the decline in non wind/solar energy will leave it at 6500 MTOE.
So in 2050 wind and solar will have to provide 11500 MTOE from 445 MTOE in 2017.
Oil is currently about 4000 MTOE per year now. Its taken 100 years.
You expect wind/solar to grow to three times that level in a third of the time?
Nick, I think you are having a problem dealing with reality here.
hmmm. I'll have to play with the numbers, in order to answer specifically. I don't have the time right now.
A few thoughts:
one of the problems with this analysis is the "tonne equivalent". In effect, the (IIRC) 4,200 conversion factor assumes that electricity is 2.6x as useful as raw btu's, because european oil-fired electrical generation is 38% efficient (1/.38=2.6). This wasn't a big deal for BP's analysis, in part because renewables were a small part of the mix, but it's inaccurate in the context of GG's scenario. In fact, electricity is about 5-20x as useful as raw btu's in transportation, HVAC, and other uses, so it won't have to grow as fast as otherwise.
It also doesn't include increasing energy efficiency (though that's the main point of the Ayres research on which the scenario depends): a PC with a 40% efficient transformer uses 2x as much electricity as a PC with an 80% efficient transformer, but does exactly the same work. The same thing applies to a Prius replacing a Hummer for single occupancy commuting (80% reduction), and so on. The world has gotten 2-3x (IIRC) as efficient in the last 30 years, and it will certainly do that again in the next 30.
Please don't take offense when I say that your argument seems to be "gee, that seems like an awfully big number!". Yes, wind/solar will grow just as much as we need it to in the next 43 years. Manufacturing like that is easy to expand at 10-40% growth rates for at least as long as would be needed to satisfy demand: there are no resource, supply, or manufacturing capacity limits in the range of growth we're talking about, and unit prices will plummet with volume, especially for PV, which will almost certainly be dirt cheap in 20 years (in a way that will rival gasoline 40 years ago).
Oil grew at comparable rates for multi-decade periods, and it could have grown at those rate or more for longer periods, but it was limited by demand. Ultimately, of course, it ran into geological limits, but wind/solar (and nuclear) won't.
And, as far as electricity is concerned, demand will be the limiting factor as well. The bigger problem will be the transition to electricity for transportation & housing, especially for the poor, who will have to wait quite some time for used vehicles.
In the long term, energy supply isn't a problem.
I'm much more concerned about the short term transition, about climate change, about the US selling off it's national assets to buy oil, etc. I'd be delighted to see some serious analysis of those things.
Nick,
Have a look at this presentation as well:
http://www.belfercenter.org/files/uploads/Continental_Wind_web_Nov07_opt.pdf
The basic thesis is that 60% electricity consumption can be covered with wind if the power system does not have large bottlenecks in continental scale and 40-50% if the system is of regional scale (however, this would depend on the regional patterns a lot). This is with conventional power plants only, one could do more with electricity storages or flexible demand. Only after those levels one will start to waste wind electricity in meaningful amounts. Changes from hour to hour should be slow enough for conventional power plants to start/stop.
John,
Thanks for that link. Very clear presentation.
Chris
If you were to use Nick's exponential fit for wind and solar and plug that curve into fig 13, how much would it change?
GG is your .xls available for us mortals to fiddle with?
Yes, it's at http://www.paulchefurka.ca/WEAP2/WEAP2_data.xls
but I can save you the trouble. Here are the curves: 2nd order polynomial and exponential for wind, and third order poly and exponential for solar. I've also included projections limited to 20 years for the exponential cases, so you can get a better idea of the near-term performance.
"We report, you decide."
So, would you agree that your exponential fit to wind obviates any reduced energy availability owing to a decline in the supply of oil in your model?
I'd be interested in the reduced chi^2 statistics for your fits.
Chris
Thanks!
I agree that in the rear-view mirror the adoption curve of wind and PV will probably turn out to be sigmoid. When I investigated the possibility of using such a curve in this projection I ran into a problem, though.
A sigmoid is defined by the initial slope, the time of transition to hypergrowth, the slope of the hypergrowth portion of the curve, the time of achieving saturation and the level of saturation. In order to use this curve for projections, the projector needs to make assumptions about each of these five parameters. As I said in my emails, I much prefer to keep my hands off the curve and make as few assumptions as possible. In this case those assumptions were confined to the choice of a curve with as good fit as possible to the existing (small) data set, and whose y-value in 2050 passed my sniff test.
"In order to use this curve for projections, the projector needs to make assumptions about each of these five parameters. As I said in my emails, I much prefer to keep my hands off the curve and make as few assumptions as possible."
But that's an illusion, that deceives you and your audience. You're using the wrong equation, because it just happens to give results that fit your intuition. It allows a deceptive appearance of analytical rigor, and avoids an explicit specification of your assumptions about wind/solar growth.
"In this case those assumptions were confined to the choice of a curve with as good fit as possible to the existing (small) data set"
There's more data than that - previous years which show the same exponential growth, and current install growth which continues to show the same or higher growth rates. Furthermore, it only fits by arbitrary tweaking. You can always get a polynomial to fit anything if you add enough terms.
"and whose y-value in 2050 passed my sniff test."
Sniff test? Sniff test??? You really ought to be more rigorous than that....
Let's say I decided to use a sigmoid, which is more likely to be close the actual shape of the curve than either of the ones we're arguing over. How would you propose I arrive at values for saturation level and saturation time? What would your estimate be for those values, and how would you arrive at it? Could you present objective evidence to support your choices?
Realistically, the shape of the growth curve between now and 2050 won't be any of these three (polynomial exponential or sigmoid) - it will be all bumpy and wiggly, with fits and starts and maybe even a retracement or two. The point of the exercise really isn't, "What shape is the curve between now and 2050?" Rather it's "What amount of wind and solar will we have in 2050?" What path you follow to get there, be it polynomial, exponential, sigmoid or SWAG, really isn't a determinant.
The crucial question for the world is, "How much renewable energy (or its benefits) are poor nations likely to have access to in 2050?" You simply can't answer that question with curves, it has to involve a judgment call on the part of the extrapolator. The real limit is not what is technically possible, it's much more one of what people are likely to do or not do. It involves assessing the priorities individual nations will set within the constraints of their economic and resource circumstances. And putting that stake in the ground requires more than just fitting a curve. My globalized estimate for that number is implicit in my acceptance of the 2050 end-points of my extrapolations.
What is your estimate of the penetration of wind and solar in 2050 and why? It's time to put up ...
Well, I think we've made progress.
I agree: the growth curve for renewables won't be simple.
Are we agreed, then, that electricity supplies are unlikely to be a problem in OECD countries, and that PO is more a financial, liquid fuel and developing country problem?
As to saturation points and 2050 market share for wind & solar - that's a great question - it depends enormously on public policy (and the extent it overcomes resistance from FF related industries and their employees & customers), especially for climate change.
Wind is about 8-10 years ahead of solar, but solar is growing faster, and has less of a limit, due to CSP being less variable than wind, and PV being on the consumer side. Wind could start providing all new generation in 5-10 years in the US, and start displacing coal after that (though coal fuel usage will fall faster than coal generating capacity). Other countries will be slower, and variable depending on their resources and politics. China will be ok (due to it's coal, and better political organization), India will suffer more.
Solar will become cheaper than utility rates in more and more places in about 5 years - it's already there for some uses in Africa. Dirt cheap PV will make a big difference for developing countries.
In 2050? I expect that electrical generation will be adequate in almost all of the world, and roughly equal amounts of wind, solar, coal, and nuclear, perhaps 21% each, with 16% other - geothermal, wave, biomass, NG, etc. Solar might be a bit more, coal & nuclear less.
The US will electrify transport fairly quickly, over the next 15-25 years. Again, other countries will be slower, and poorer countries will be hit hard by the expense of replacing ICE's, but by 2050 they'll be there.
The lights could go out in Britain within eight years as demand is predicted to outstrip supply
http://business.timesonline.co.uk/tol/business/industry_sectors/natural_...
"This is not the postapocalyptic vision of some film-maker, but a realistic scenario as Britain grapples with a looming energy crisis. The statistics are frightening. In only eight years, demand for energy could outstrip supply by 23% at peak times, according to a study by the consultant Logica CMG. The loss to the economy could be £108 billion each year."
Nick, I don't think its as simple as you'd like it to be.
You are still not understanding renewables. There can be no retracement without widescale destruction of renewable generating capacity. A coal plant that goes out of business reduces generating capacity, but a turbine factory that goes out of business does not. In fact, it gets bought up for pennies on the dollar and keeps adding to renewable capacity finding a below market price niche to reduce investor losses. Curently market prices are well above production costs and so there is quite a lot of reinvestment, but a substantial reduction in demand still implies growth in renewables because prices will go to very narrow margins above production costs for as long as this cuts losses more than closing production. Renewables have very different properties than the fossil fuels you are used to thinking about.
Chris
On the other side of the energy equation, our middle case is that the top five net exporters hit zero net exports in 2031.
This looks much better than the first post. Thanks a lot for listening to the comments you got. While I still think that you are very pessimistic on wind and solar growth, I won't go into that.
An important point is that your numbers are primary energy consumption. When you start replacing coal, natural gas, and oil with wind and solar, your primary energy consumption will go down, while enjoying the same utility from the energy. With wind and solar you are not wasting two thirds of the original primary energy as heat (well, this varies: with oil in ICEs you'll waste three quarters or more, with new coal plant maybe two thirds and combined cycle natural gas is close to half). So, while your graph shows declining primary energy, useful energy is probably not really going down.
Hi JohnK
re: ", while your graph shows declining primary energy, useful energy is probably not really going down."
Could you possibly expand upon this, perhaps w. an example? And is it possible to quantify this in some way?
re: "...not wasting two thirds of the original primary energy."
I don't know how to account for this (assuming someone else does), the thing is - in the real world, we have to account for the (energy) costs of both build-out and of on-going maintenance, do we not?
I'll try to make the coal example more clear. To produce one unit of electricity in a modern coal power plant with efficiency of 40%, one would need 2.5 units of energy from coal. 1.5 units are lost as waste heat. The efficiency can be improved by producing higher temperature steam (according to second law of thermodynamics), but there are limits that are set by our understanding of materials and costs related to using those materials in power plants. There are also losses that accrue during mining and transportation of coal.
In comparison, to produce one unit of electricity with wind, one needs somewhere around 1.1 units energy out of wind that passes the turbine. The 10% that's lost is converted to heat as friction in the turbine and in the increased turbulence of wind. However, the primary energy consumption in the statistics is electricity produced by hydro, wind or solar power plants (not taking any losses into account) and primary energy of the fuels consumed by the thermal power plants. Therefore statistics mislead unless one is aware of the difference.
For example hydro and nuclear produce about the same amount of electricity globally, but nuclear is three times bigger in the primary energy consumption. There is a clear example of useful energy versus primary energy consumption. I'd love to put this into numbers and graphs, but it would be too much work for now. One should dig up information on different categories of energy usage and how well the energy in fossil fuels is used in these categories in relation to replacing it with wind or solar electricity.
I'm not quite sure what you mean, but I'll still give it a shot. Wind power plant produces the energy that goes into building the plant in a year or so (with considerable variance from study to study and to lesser extent from location to location). And this energy is electricity, while lot of the energy that went into building the wind plant was lower exergy energy like coal or natural gas. So the same caveat as what is under discussion. To my knowledge maintenance consumes relatively little energy. One should also consider that mining or drilling for chemical sources of energy have energy expenditures.
You have a point about ICE engines (but then there must be an assumed adoption rate of non ICE engines). But for feed stocks, industrial heat, and space heating that factor will not apply (or I don't believe it will anyway).
Can you help improve the analysis by detailing out the energy pathways and totaling the impacts?
Jon Freise
Analyze Not Fantasize -D. Meadows
There was a previous post by half full that expressed the same concern with better terminology. I missed it before I posted mine.
You are absolutely right that there needs to be some serious adoption of electric drive train vehicles before wind and solar could start to contribute to transport sector.
I was thinking more about the electricity production and transportation when I posted, but things apply to heating and cooling as well. However, one needs to have heat pumps to be able to use the higher exergy of electricity. Heat pumps will increase the capital expenditure and while we are seeing more and more heat pumps installed, increases in fuel prices coupled with advances in heat pump economics would be really helpful to make the growth faster. Space heating heat pumps typically produce 3-4 units of heat energy out of unit of electricity, although this is dependent on the temperature difference one can use (air heat pumps won't help you during really cold weather, although with more expensive ground heat pumps this can be averted).
Industrial heat is more complex question, since it depends on the use of the heat. I'm not much of an expert on this area, but reading up in the internet told me that heat pumps in drying, evaporation, and distillation processes can have a COP of 5-30. This means that you'll get 5-30 units of thermal energy out of one unit of electricity. Steam production is more challenging, especially if one needs to raise the temperature a lot. It also appears that really hot steam is not possible with current technology. Great source for more information is IEA co-operation site on heat pumps.
One nice thing about all kind of heat applications of electricity is that heat is much cheaper to store than electricity. Therefore it would be possible to increase the flexibility of the power system by having more interaction with heat demands. This would make it cheaper to integrate more variable power into the electricity network. In some applications some heat storage comes with the application and often it's possible to increase this storage. Space heating is a good example, since houses hold heat for few hours, especially if they are well insulated and some heating systems have sizable hot water storages. Heat pumps are finding their way to district heating systems as well, in which heat pumps could interact with CHP power plants, hot water tanks and heat boilers (when electricity is really cheap).
I don't know how much energy is going to feed stocks, but I suspect it's quite small share of total energy. In there the higher exergy of wind and solar electricity probably won't help since in feedstocks it's the atoms and molecules which are important for the process.
Unfortunately I don't have the time at hand to make proper calculations. I do research in energy systems and I'm hoping to have time at some point to look at these issues in more detail, but that's not going to happen before spring.
your primary energy consumption will go down, while enjoying the same utility from the energy
On a related note, we can trade 17 to 20 BTUs of diesel for 1 BTU of electricity by shifting freight from heavy trucks to electrified railroads. Expanded rail capacity, local transfer points and modern scheduling can do this with minimal negative (if any) impact. This shift would have much higher utility for public safety, pollution and infrastructure support.
A massive build-out of Urban Rail can have comparable energy impacts, creating low energy, walkable neighborhoods clustered around Urban Rail. I would argue that the utility of such communities is greater than our current Suburban & Exurban model.
If new TOD housing was built to a high level of energy efficiency (say comparable to current German standards), then the savings would be even greater.
Best Hopes for Energy Efficiency & Long Lived Infrastructure,
Alan
As Robert was alluding to in the previous post, the difference between a polynomial fit, and an exponential become overwhelming after a couple of doubling times. I think your extrapolations for renewables are grossly pessimistic for this reason. I think some forms of PV are growing at about 40%/year, and if this stuff becomes cost competitive due to economies of scale, better technologies, and increased costs of the nonrenewable alternatives, it could enter into a whole new dynamic growth phase.
If for simplicities sake: assume that energy is the critical resource. Then any technology with positive EROEI is viable long term, while the maximum exponential growth rate is determined by the inverse of the energy payback period. If the later were say ten years, then energy could only increase by a factor of E every decade -and that assumes 100% of the energy is used to build new capacity. Clearly research that decreases the payback period is of critical importance.
I don't think research budgets are going to decline. Currently few in the developed world are pursuing careers in such areas, but millions in Chindia, and Africa would jump at the chance. I wouldn't be at all surprised if the distribution of rich/poor areas on the globe were to flip-flop over the next century.
Another technological possibility which might support your hydro-power projection, osmotic power. If an filter for
osmosis is used across a fresh-water/sea-water boundary over 100meters of head can be created. This method could be thought of as a way to discover new hydropower resources.
Business as usual from now with nearly full employment and continued economic growth, will of course provide means to expand the alternative energy you propose.
Of course if the economy declines or crashes that leads to a different outcome.
I may as well throw my opinion out with the rest..........
I think the world economy will crash. For various and interrelated reasons including the high price of energy and/or lack thereof.
If that happens, business, large as well as small go bust and stop employing people.
That heralds the demise of the developed world's consumer based society.
Catch 22
In the good times like right now I suppose.........
They would/could not be manufactured in the numbers required to offset the decline in future fossil fuel, because they could not be sold in amounts able to support the "economy of scale", in other words provide big or enough profits.
Fossil fuel energy was/is cheap, (has to be to support an expanding economy)too cheap to force individuals or businesses to adapt, competition ensures that.
In the near future when individuals and businesses must purchase the alternatives to stay viable, it will most probably be too late for the majority, unemployment, debt and other commitments will hinder individual purchases.
So I hold just about zero hope, that "alternative" energy will provide anywhere near the required "offset" to fossil fuel depletion. There is no doubt it "can" but it won't. A failed economy is never considered. National, business and personal debt is the proverbial "elephant in the room".
It would be hard for figures to convince me otherwise, while we have the human condition, economy and politics firmly in the mix.
It is best to dig the well before you are thirsty.
Bandits, I regretfully agree with you regarding financing of alternatives.
I believe that the Fed is scared to death that the teetering tower of "credit derivatives" is inherently unstable, and once it starts to unravel no institution will be able to put it back together. If the derivative bubble does implode, the resulting disappearance of trillions in "liquidity" and increased risk aversion will make it very difficult to finance ANY projects not having a long-enough history to permit risk/reward analysis.
As another poster puts it, there are three complexly inter-acting factors of collapse: energy, economy, and ecology.
PLAN, PLANt, PLANet
Errol in Miami
You mean ten months, not ten years. I don't know any energy source in the world that has only a ten percent per year payback on energy. Well, unless you count ethanol from corn or some other silly thing like that.
Energy payback for coal, wind, solar, is around 10% per month, depending on local conditions.
Paul: Very detailed and easy to read overview of the world energy situation. Great work. One question: CTL has somehow dropped off the face of the earth. It was supposed to be in full swing by $100 oil and it doesn't appear to be going anywhere very quickly. I still think that it will be huge when oil depletes enough, causing coal to deplete MUCH quicker than forecast and coal prices to skyrocket. I think you might be underestimating the political forces that will sacrifice the future for an extra drop of transportation fuel right now. I am also skeptical about China regressing-it might happen but at this point I would bet on China being the clear economic superpower by 2050 (IMO).
Brian: interesting comment on CTL being a near noshow so far. This might have to do with oil prices rising faster than the time it takes for project preparation and approvals. I suspect we have a political battle abrewing. The NASCAR dads will want fuel at any environmental cost, the rest of us want to avoid catastrophic global warming. Should be an interesting time a comin.
Personally IMO I think cellusosic ethanol will gradually replace oil as the transportable transportation fuel, although not in anything near the present volume. The real question is whether the replacement of the vehicle fleet with plugin hybrids will occur as fast as the oil based fuel supply shrinks. Should be another interesting thing to watch.
I am not sure I get this article. If we discover a big problem and do not do what we can to mitigate it, other than what we are doing now before it is recognized, it will get worse. Well, duh!
OK, so fossil fuels will not be available. But we could, for example, have a big nuclear buildup from what is effectively a moratorium. Why is that not considered? What would prevent a 10 to 20 fold increase in nuclear power in the next 50 years? (BTW, almost all reactors will most likely soon have their licenses extended to 60 years and then 20 years later have them extended to 80 years.)
Projecting out 50 years without considering obvious steps that people could take, and therefore almost certainly will take, to mitigate the situation just gives you a meaningless projection.
Well, GG, I appreciate your posting of my recent comments, and others have covered some of the same points. Still, I've got to weigh in...
1st, the polynomial equations for renewables only fits because of the use of a short period of data. If you look at previous data, it too is exponential in growth. What you really want is a sigmoid function, which showls exponential growth early, and then levels off as demand is satisfied. Of course, the fit won't be perfect, as renewables are actually hyperexponential right now. The only question, really, is how much higher wind/PV growth is going to be than the 30% seen fairly recently: I recently saw an estimate of 60% wind growth in the US in 2007, and a projection of 100% growth for PV worldwide next year.
Here are a couple of thoughts:
"I think it's equally unrealistic to expect that (renewables) will achieve a dominant position in the energy marketplace, due to their late start and their continuing economic disadvantage relative to coal."
As long as coal is cheap and plentiful, it will compete with other sources like wind and Concentrating Solar Power for utility generation. OTOH, PV on the consumer side is exploding now, and will continue to do so as it passes parity with utility prices in the next 5 years.
When coal starts to be scarce, renewables will see even more demand growth.
[edit}
a few more thoughts:
"Because both the wind and solar power industries are still so new, it is possible that they may exhibit higher growth rates in the future, "
That's not what you mean to say. What you mean to say is "it is possible that they will sustain their current growth rates in the future".
I suspect very cheap PV will make a difference in places like Africa. Already PV and LED flashlights are providing lighting that's cheaper than the kerosene lamps that are standard in Africa.
Finally, PO isn't an energy problem, it's a liquid fuel problem. I don't think there's any plausible reason to forecast sustained shortages of electricity due primarily to fuel shortages. The real problem will be converting to electric transportation in developing countries.
No, that's what you wish I'd said. What I actually meant to say was, "it is possible that they may exhibit higher growth rates in the future than I have projected here." I emphatically do not think they will sustain their current growth rates for long (i.e. longer than another decade or two).
"That's not what you mean to say. What you mean to say is "it is possible that they will sustain their current growth rates in the future". - No, that's what you wish I'd said. What I actually meant to say was, "it is possible that they may exhibit higher growth rates in the future than I have projected here." "
Well, sure. I misunderstood "in the future". OTOH, higher than your projections means closer to their current growth rates. :)
"I emphatically do not think they will sustain their current growth rates for long (i.e. longer than another decade or two)."
Neither do I - they don't have to in order to reach much higher levels than your last scenario. Heck, doubling every 2 years for just 10 years, as wind is in the US, gives roughly 25% market share, which is probably a bit higher than the US grid will be able to handle in 10 years.
Paul
This is great work - thanks for your efforts.
Have you considered how your gross energy charts would look if you include the energy cost of the second half of oil,gas, coal etc. e.g. those energy sectors themselves will be much larger users of energy going forward, leaving less left over for the rest of society. Anecdotal evidence in many areas (Louisiana, etc) are close to energy break even already -perhaps US as whole on new oil finds (e.g. Jack II).
In other words, this analysis, much like the Limits to Growth does not account for the extremely central issue of declining net energy.
Nate,
How do we match the EROI curve against the hubbert curve? Do they peak at the same time? From the Louisana curve you have posted before, it looked like the drop in EROI was faster than the climb.
I agree it is important to model EROI. How would you recommend approaching the problem? It would be cool if we could create some standard methods (even if they get amended later).
Jon Freise
Analyze Not Fantasize -D. Meadows
The first key step is to acknowledge that reporting net energy as opposed to gross energy is important. Though its difficult we can make some assumptions. We are pretty confident (from work by Cutler Cleveland and others) that the energy required to find, and obtain a barrel of crude oil in the US went from over 100:1 80 years ago, to 30:1 30 years ago down to somewhere above 10:1 circa 2000. It can be assumed, based on anecdotal finding costs, etc. that it has declined quite a bit since then.
To take this as a first order approximation and run analyses that incorporate allocating an increasing amount of the worlds energy allocation to the energy companies themselves will accomplish an important goal -it will make the situation appear as serious as it is.
Beyond that, we need better data - but we have multinational corporations and state run oil companies who are wont to share their dollar data, let alone energy data with a concerned public...
But net energy is one of the most important issues attached to Peak oil - the debate about corn ethanol and other alternatives and how much they are greater than 1 on energy return is a canard. - We care about what they are replacing, not if they are greater than unity.
That is a start on oil. Somewhere Odum did a study on stripper wells and found them energy negative. I have not read it. If someone has seen a copy we might be able to discover the minimum flow rate to be energy positive.
We can roughly box in Natural Gas because we know LNG uses 10% of the volume during transport, so it cannot be better than 10:1 EROI, is is likely down at 8:1 or more. So when domestic gas becomes more expensive than LNG, we have a marker.
I am not sure how we should compare LNG prices (set by long term contract) with NG spot prices. Any thoughts on how to do that to get a more accurate EROI?
The Millenium institute T21 model for North America has EROI calculations in it, but none drop below 10 for oil and gas. I think they need to separate imports from domestic because the US is such an old production region.
Jon Freise
Analyze Not Fantasize -D. Meadows
That would have to be boiloff due to inward heat leakage; petroleum, not being cold, has not that loss and spends only about one percent of itself in transporting itself 10,000 km by sea.
What is the source for the 10 percent boiloff figure?
--- G. R. L. Cowan, former hydrogen-energy fan
http://www.eagle.ca/~gcowan/boron_blast.html :
oxygen expands around boron fire, car goes
I gave the wrong impression with my last sentence. I meant, the cost of liquification, transport, and regassification was about 10% which was from an interview with Chris Skrebowski on GPM.
Julian Darley in "High Noon for Natural Gas" quotes 15% for transport from Qatar to the US. So an EROI of 7, dropping to 6:1 if we assume 80:1 NG as a source.
Isn't it 5:1 that has been calculated as the minimum needed to support an industrial society?
I think I would rather have 40:1 wind and a heat pump myself.
Jon Freise
Analyze Not Fantasize -D. Meadows
You should apply percentage to the left number, e.g.
15% loss in case of 80:1 is (80 * 85%):1 which equals
65:1 (not 6:1)
No. The 15% is not the loss of EROI, it is the loss of BTU content.
80:1 means that 80/100 = 0.8% of the energy out is consumed harvesting that energy.
15% + 0.8% = 15.8% To get to EROI we take 100/15.8 = 6:1 (rounded).
Jon Freise
Analyze Not Fantasize -D. Meadows
OK, but i'm not sure that this 15% loss in this case can
be named as energy invested, it is taken from the same
energy source (produced gas field).
it is akin to saying - "an EROI of picking two bars of gold
on the street is 2:1 because one bar from them (a half) i need to give
to my companion"
gTrout, look at it this way:
You invested 1Mboe of Your enegry and got 80Mboe of gas.
15% of gas lost in transit - 65Mboe of gas is left.
End result: 65Mboe of gas vs. 1Mboe of Your investment,
or 65:1
EROEI is not an economic efficiency and it should not be used as a parameter to characterize the economic quality of energy production. I think that this assertion can best be demonstrated by using an analogy that does not involve energy. Platinum is very expensive resource. I have read that 7 to 12 tons of ore have to be mined and processed to produce one gram of platinum. Producers of platinum have to compensated for this effort. Naturally consumers of platinum are anxious to the get the most efficient use out this substance that they can. An economic efficiency is defined as the ratio of output to input. So if PEM fuel cells of a particular type are being manufactured the ratio of the number of fuel cells produced to kilograms of platinum consumed would represent the efficiency with which platinum is converted into fuel cells. Every time a new batch of fuel cells is manufactured many additional tons of platinum bearing ore have to be mined and processed.
Now suppose that instead of manufacturing fuel cells we have figured out a way to transmute lead into platinum. Furthermore suppose that this process requires a certain amount of platinum to be in the chamber to ‘seed’ the process. If the platinum output of a batch is larger than the input the process has a positive platinum balance and net platinum has been produced. For simplicity let us suppose that the ratio of output to input is 10 to 1. Once this process is up and running no further platinum purchases are required. We can simply save 10% of the output of each batch to use as the seed for the next batch. In fact, if for a period of time we save 20% or 30% of each batch we can seed other transmutation machines, so that we can increase our output of platinum by an arbitrarily large amount (assuming that our supply of lead holds out) without anyone having to mine another ounce of platinum bearing ore. Note that it makes absolutely no difference to the economics of this process whether the seed platinum is consumed and the output platinum is completely new or whether the seed platinum survives and new platinum is added to make up the total output. All that matters is the net platinum produced by each run. To speak of the platinum cost of such a process or the efficiency with which platinum is turned into more platinum is meaningless. The efficiency with which other production resources are turned into platinum can be calculated by taking 90% of the output and dividing by the amount of resource (e.g. labor hours, kilograms of lead, kWh of energy) consumed. However, the ratio of output platinum to input platinum is not an economic efficiency. Suppose, for example, that no seed platinum whatsoever was required, but that the transmutation process was otherwise identical. That is the inputs of lead, labor, capital equipment, energy, etc were the same, and the gross output of platinum per batch were the same. The ratio of output to input is now infinite, but the productivity improvement is a modest 10%; Instead of being able to count 90% of the output as net production we can now count 100%.
The application of these ideas to energy production is obvious. The mistake being made in taking the ratio of output energy to input energy as an economic efficiency is that both the numerator and denominator in such a calculation must represent net quantities. That this assumption must be made is so intuitively obvious that it is not explicitly stated. So if the output in question is widgets from a manufacturing line and a final inspection rejects 5% of these widgets as defective, then no one would dream of counting that 5% as part of the output. If the input of concern is labor and a laborsaving piece of machinery is introduced, then in addition to subtracting the labor saved by elimination of the old process we must add in the labor required to maintain the new machinery. A given economic process cannot produce net energy and consume net energy at the same time. It does one or the other. If net energy is produced then the ratio of that energy to the consumption of some other resource is an economic efficiency, but the ratio of output energy to input energy is not.
As I have explained before, the fraction of the output energy which is left over after the input energy is subtracted out is a useful parameter, and the ratio of this ‘energy utilization rate’ to the expenditure of some other production resource is an economic efficiency which can be useful in characterizing the energy production process.
What!!!!!!!!!!
I put it much simpler.
The energy which goes in (what I eat) has to be enough for me to dig the ore out, it has to pay for more food, shelter and clothing so I can continue to dig. If I don't get enough return I don't/can't dig. EROEI.
It is best to dig the well before you are thirsty.
I agree, Nate. However, it's hard to make supportable, quantified assertions about the net energy of various sources in different regions of the world. A qualitative argument on this subject would of course be helpful (even essential), but in the context of a quasi-quantitative analysis like this it leaves the quibble door wide open. We all know what happens to discussions like this when the "detail and assumption police" start pulling at any loose threads.
A discussion or analysis of net energy will be very useful, but it should happen in a somewhat different context. I was hoping with this article to create a broad baseline that discussions like that could use as a starting point.
Just an observation on net energy of 'renewables' such as PV and wind.
If the a-priori assumption is made that the electricity generated by PV and wind will be available on demand, then it only makes sense to include any storage systems into the EROI analysis. This means that batteries or pumped hydro or compressed air systems, etc. would enter on the negative side of the balance. I don't believe that the typical energy-payback study of wind or PV does this, hence unrealistic figures.
" it only makes sense to include any storage systems into the EROI analysis."
It would, but none will be essential until wind market share becomes much higher (10-20%). Even then, it will be for a small % of kwh's.
Demand management will be much more important, especially for charging of PHEV's.
Greetings.
Excellent article.
Just a few points I'd like to add.
1. Nuclear fuel supply is presently augmented by previous efforts. IIRC, the USA and CCCP spent huge sums of money digging up as much uranium as they could in the 50s and 60s and 70s. This resulted in a glut of fuel, and has affected the price of uranium (making it cheaper). Again, IIRC, about 25% of the present fuel is from this massive stockpile and the decomissioning of weapons. Once the stocks are used, or the nclear powers get uncomfortable with the level of overkill they can project on an enemy, that fuel will be taken off the table, and the price should escalate rather intensely.
2. IFR reactors really don't care what you throw into them, but so far, none have been able to work, and drowning a nuclear stockpile in a pool of liquid sodium has a number of ummmm... "why does this seem like a stupid idea" written all over it. Also, IIRC, no IFR has been built that will run properly. This could change, of course, but somehow I have my doubts, especially given the expense of one IFR versus covering a jillion acres with windmills.
3. Speaking of windmills, I've been reading up on vanadium redox batteries. IF they could be built in sufficiently large enough size and quantity, they could provide the load stability presently missing from wind. Of course, it would have to happen on a completely transformed grid, so there's another hurdle, but the expense of nuclear could be directed into wind and solar for a cleaner bang for the buck.
4. As energy gets more expensive and economies take major hits and decline, this will tend to work toward demand destruction and reduced energy demand. This could help in cushioning the angle or slope of decline, especially as most of the energy is consumed in countries who's economies are most tightly tied to high energy industrialism. In other words, if a culture, say, somewhere like Ethiopia, consumes say, 1/10 the amount of energy Mtoe of the USA, even if they double their population, they will still be consuming VASTLY less than a western industrialised nation compared on a per capita basis. Hence, their use of energy is comparatively less elastic - they use less, and when they need it, they need it (viz natgas and fertiliser) as compared to the USA where resource obscenities like the cities of Las Vegas or Los Angeles are seen as a cultural icons.
The USA could ditch Las Vegas easily - the American .gov let New Orleans disappear, and it was a significant port. Las Vegas has no redeeming value at all, and is, essentially, an "extra city" that could be abandoned as part of American Elasticity.
Essentially, the USA and Canada are energy hogs, but they have so much fat to cut, that an economic downturn in N. America could result in such significant demand destruction that countries who actually build stuff with their energy (like China) could avoid dropping to desperate poverty status, as they refocus their production capacities to service their own internal market.
5. The decline per capita in energy will result in increased poverty, I am in agreement with that, and while projections are 9 billion by 2050, we can pretty much assume that between now and 2070 about 6.5 billion people will die - i.e. almost everyone alive today will be dead. So, as the demographics go off the cliff in industrialised countries through family planning, in developing countries it may go off a cliff due to famine. The net result could be fairly rapid decreases in demand after 2060 or so, again, making the sustainable energy programs of earlier in the century that much more important and useful.
Anyway - I'm rambling. Good work. THANKS!
Stuart Studebaker
Toronto, ON
CANADA
The total world production of vanadium is 100,000 tons per year. Sodium sulfur makes more sense for off peak power. Vanadium flow cells are niche applications. Zinc is 7,000,000 tons per year, but requires bromine or chlorine for flow cell technology. Too dangerous to operate in urban areas.
For a while. But then the mining companies will start exploring seriously, perhaps for the first time. Since we know Uranium is pretty plentiful in the crust compared to how much is used in power generation, the end of weapons material dumping should not have that much effect on the long term price.
This is a very plausible view of the coming energy scenario and its likely impact on population. However, the people who read it will in the main already have some appreciation of what is really happening. The essay is valuable to them in refining their views. The vast majority, including those that make the big decisions on using energy, still believe in the economic growth paradigm. So mitigating action is most likely to be responsive to developing market forces rather than proactive based on understanding of the dependence of the operations of society on what is now available from the ecosystem (‘The Dependence on Nature Law’
http://candobetter.org/StarkReality)
and the connection between fossil fuel usage and the consequential irreversible climate change (The Immutable Duality.
http://candobetter.org/node/238)
This is great work. I've done some too, but TOD won't post it, but it is at http://www.peakoilassociates.com/POAnalysis.html at least until TOD deletes this comment.
An excellent report ...
I compare this work with Dave Rutledge, http://www.theoildrum.com/node/2697#more Both have the peak fossil fuel at about 2015, and about the same magnitude of peak (if Rutledge ordinate scale is really Gt carbon per year, rather than Gt carbon, as it is labeled) If the Rutledge analysis of the effect of this emission profile on atmospheric CO2 were repeated with Glider's emission profile, the result would be very much the same. So..., peak fossil fuel will abort global warming by both analyses. But some say there is much more coal than either Glider or Rutledge estimate. Glider lifted his coal numbers from a seemingly credible source. Rutledge made a Hubbert linearization analysis, and an argument about how bureaucracies are prone to make mistakes in estimation.
I think we can't have BOTH peak fossil fuel AND serious global warming. We've got to choose one or the other to worry about. So this is good news on the GW front.
Why am I not happy?
There is little to be happy about. 99.9999% of the U.S. population is suffering from multiple delusions about the troubles we face.
I would hesitate to predict what global energy supplies will be past peak oil, for there is an immense amount and diversity of energy available. As I see it, the problem is the infrastructure change needed to utilize these other sources. For example space-based solar energy--an immense quantity, but the barriers are also immense. I think the needed infrastructure changes will take 10-20 years, depending in part on how fast oil prices rise. Those years will, likely, be very hard years, but once the infrastructure changes are in place I think there will be plenty of energy again.
I live in the coldest city on the planet in terms of design criteria (you need to build your heating system to handle -75F). I used to burn 1,200-1,400 gallons of heating oil a year to heat my house. Two years ago I decided to drastically cut my fuel consumption. What I noticed is that now, instead of a single primary heat source (oil), I use a multitude of energy sources (mostly firewood supplimented with coal, biodiesel, solar, propane [mostly while cooking, eg we will have a cooked breakfast instead of lighting a fire], conservation [seldom heat the house warmer than 68, added insulation to the ceiling (+12" for a total of 24") and 2 exterior walls (+8") not to mention a typical morning temperature inside of 56-64]--as well as about 400 gallons of heating oil).
I think (at least in the short term) we will be using a similar variety in vehicles. I can think of a dozen different ways to run a vehicle without gas or oil: biodiesel, alcohol, solar/battery/electric (over the course of a year a car in a sunny climate has enough energy fall on it to run it), propane, natural gas (from decaying vegetation [dumps? sawdust?], methyl hydrates [if they can be produced economically], coal-derived fuel, wood-gas, electric, tanked hydrogen, hydrogen produced on-board from (say) aluminum and lye+water (there are other ways to generate hydrogen--the key is how to reverse it), acetylene from water + calcium carbide ["my car runs on rocks?!"].
I agree that moving away from oil will mean a reduction in the standard of living (possibly severe, depending on how fast the oil decline rate is compared with how fast the infrastructure changes occur that are needed to use alternatives). During periods of -40F weather it takes my wife and I up to 20 hours a week to cut, haul and feed the fire to keep the house warm--and even then we frequently get temperatures in the 50's in the morning (unless we get up in the middle of the night to feed the fire--although with the additional insulation on the outside 2 walls I'm hoping this winter it will stay a little warmer). I'm not sure how much time you'd have to put into generating enough methane from sawdust to drive your car on an annual basis, but I'd bet it will be a LOT more than the few hours needed now to earn the money to buy gas!
I'm not sure I agree with the analysis of 3rd world countries either. They live a lifestyle a lot closer to pre-oil, and as a result it will be easier to revert. Yes, fertilizer will be a lot more expensive, but the US (etc) reliance on oil is nearly absolute: if the US were to loose 60% of our oil I think a lot of people wouldn't make it. So I'm not sure our greater financial resources will offset our greater reliance on oil--especially when countries are likely to cut us off from oil when they have to choose between making a lot of money exporting oil or keeping their citizens fed. (Especially Russia, Saudia Arabia, and Iran.)
Gas is a completely different story. If (IF) we can figure out how to extract methyl hydrates, then we have an essentially unlimited supply of natural gas: some of my geology professors presented information indicating there is enough methyl hydrates to consume all the oxygen in the atmosphere! If we can't...I agree with the analysis!
Once peak oil hits and the price of oil skyrockets (how high will prices have to go to curb 5% of demand? 10%? 50%?!), I think the energy picture will be so different that using past patterns of energy development (eg solar) won't be much use for predicting future development.
All this said, kudos for an excellent article: well researched and written. Thanks!!
Let me suggest an alternative analysis, which I am not going to try to fill in, at least in a detailed way.
The alternative analysis is presented by World War II.
What is demonstrated by World War II is that a modern industrial society, given adequate incentives, can mobilize a very large fraction of industrial GNP to novel purposes, not instantly, but rather rapidly. In the six months after Pearl Harbor, the United States produced such items as the Liberator pistol made, e.g., by plants that had produced mattresses. This was not large, though I extend my 'glad to be of help' to any European reader who used one.
However, on a four year time scale, major industrial nations were able to devote between 40 and 80% of GNP, including almost all industrial production, to the preparation of novel products, such as tanks and jet aircraft. Even at the end of 1943, several of the major economies had not yet finished conversion to wartime output. This was done with the usually inefficient methods of command economies, at least in considerable part, rather than with the more efficient means supplied by market economies.
Let us consider what this might mean for power production. I provide a physicist's back of the envelope calculation, the sort of thing that might be supplied by any competent politician at a national level. Allowing a US GNP above $10 trillion (US) a year, and a world GNP four times as large, a less-than full mobilization via favorable energy pricing, etc., to 25% of GNP gives ten trillion US dollars a year of production. At the current price http://www.windustry.org/how-much-do-wind-turbines-cost
of several dollars per watt, ignoring alternatives to wind such as concentrating solar, that is five trillion watts a year of installed capacity. Even allowing siting inefficiencies let us capture only a quarter of that power,
one might add 10 TW of renewable power in a decade or a bit more. Applying the well-known result that a year is pi x10^7 seconds long, this capacity gives us is pi* 10^20 Joules per year.
A ton of oil is 1 toe = 41.87 x
10^9 J) http://books.google.com/books?id=M5ozBVOCarwC&pg=PA252&dq=ton+of+oil+ene...
leading to a predicted power output of ca 7-8 billion tons of oil per year with a decade's work. That's larger than your estimated changes in power production from oil. One might suggest that using bioproducts to capture CO2 from the air to make carbon filament for structural use is more effective than corn ethanol.
I suggest that there is a challenge, but there is no obvious impending disaster. (Those checking my arithmetic should note I have followed the principle 'round conservatively'.)
George Phillies
http://www.phillies2008.org
It never ceases to amaze me that some people can see WWII as an example of the good humans can achieve. I would strongly suggest that WWII was net negative in the extreme in every way possible to calculate.
Despite its dire projections, I believe the article is being overly optimistic. It fails to factor in the likelihood that the aftermath of peak oil, soon to be followed by peak gas, will create a wake of political and social turbulence. Central governments, including the U.S., may be destablized or significantly weakened by social and political turmoil. It takes a strong and stable government to either build and operate large scale power generation systems or to provide the support required by private investors to fund such projects. The cascading effect could result in a much steeper decline.
I deliberately made the article optimistic. What I'd like to do in later installments is show how geopolitical, economic and ecological events will affect the situation.
I suspect they will all act to worsen the situation, but I've been surprised before. I've already moved off bottom dead center in my expectations of an imminent global collapse and die-off, after all: I now expect any collapse and die-off to be only regional in scope...
All projections involve guesses about the future. Its good to have a projection that is mostly, or all, optimistic. For such a projection, the future can only be worse than the projection.
And it is also good (sometimes) to have also a pessimistic projection. These are usually much less useful because they are ignored with the dismissive phrase 'he's just being too pessimistic'.
Together optimistic and pessimistic projections give some idea of the range of uncertainty in the future. A fair and balance projection is least useful since it can (and will) be attacked as both too optimistic and too pessimistic.
Your optimistic projection does seem to suggest that whatever bad that will happen, it will not involve the current bete noire, global warming.
Your estimate of nuclear, which is optimistic, does not appear to help much in solving our problem. Some might suggest that your dip because of retiring old nuke plants is unnecessary pessimism. I fear that the old plants will not be retired until after several of them fail catastrophically. So I support you in including the shutdown. It is an optimistic assumption.
This image:
http://www.theoildrum.com/files/PaulC9a.jpg
really kills me. The situation is much more dire than anyone can think of. Before, I was more afraid of the reaction to the crisis than to the crisis itself. Now I'm afraid of both. It's in these dire times that wars happen... and god knows how the earth will look if the last one standing scenario is put into place.
Good article, a more realistic assessment of the impacts, the conclusions being more credible because of that. Fig 17 should be an eye opener.
Re Fig 15, population measured in Mtoe? Not Soylent Diesel, I assume.
Excellent summation of the situation. I am almost relieved that I am not going to live till 2050 and have to deal with the spectacle of politicians squabbling over the remaining scraps of energy while billions starve.
I have, dimly, seen this coming for a long time, and the only real hope I see is fusion. Unfortunately, while billions have been thown at Tokamak style projects, the Bussard Polywell reactor has been ignored. It promises safe, non radioactive, operation of room size reactors that produce electricity directly - no steam turbine.
See
http://video.google.com/videoplay?docid=1996321846673788606
There are probably a lot of different paths out of our current mess, but I have no confidence we are on one.
It would be useful to see what some of the assumptions and curve-fitting equations you use are, since I'm having trouble reconstructing your wind curve. Using the data points and excel, I get:
0.0521*(year-1996)^3 - 0.2235*(year-1996)^2 + 4.1098*(year-1996) + 2.6152
That gives the number of GW of generating capacity in a given year, with R^2 of 0.9998. For 2050, the result is 7800GW, and at 2500h/yr (assuming capacity factor of 25-30%), we get 19,400TWh, or roughly today's electricity consumption level.
At 42GJ/toe and 3.6GJ/MWh, I get 19,400,000,000MWh / 42,000,000GJ/toe = 1,650Mtoe.
That's almost twice the level you have, so we must be using some different assumptions. Looking closely, it appears that you're not using the industry projections for 2007-2010 (which appear like they'll be conservative), which would lower your estimated amount to 1,200Mtoe. I'm assuming 25-30% capacity factor, but your result of ~950 would suggest an assumed capacity factor of ~22%.
*****
Moreover, joules of electricity and joules of heat aren't equivalent, and the conversion can be up to 3:1 (resistive heating from an inefficient power plant) to 1:1.5 (heat pump from an efficient power plant) to 1:7 (electric vehicle vs. regular equivalent) depending on what's being done. To a first approximation, though, coal and half of natural gas are used for electricity generation at 50% efficiency, suggesting that it might be appropriate to either discount coal and gas by those amounts or to increase direct-to-electrical sources by that amount (double) in order to make them comparable.
Doing the latter - with the above value for wind per year - gives an adjustment of about 3,500Mtoe/yr in 2050, which pushes the total energy up to ~10,500Mtoe/yr, or about 1.2toe per capita - roughly the level China is at now.
Stronger assumptions (e.g., substantial adoption of electrified rail and electric vehicles) could see substantial portions of electricity production (i.e., to the extent it replaces oil) use a much higher adjustment factor than 2:1. I assume those kinds of assumptions are what you'll be looking at later, though.
*****
True; however, it's worth noting that fertilizer prices represent less than 5% of the value of farm output, at least in the US, so rising natural gas prices are likely to have a modest direct effect on food prices.
I used the industry capacity figures from 1997 to 2006 as my actuals, with a capacity factor of 25%. This gives the following result for 2006:
Installed capacity: 74,000 MW; 74*8760*0.25/1000000 = 162 TWh. 162/4.42 = 36.5 Mtoe.
The curve that Excel fitted to the 1997-2006 data was y = 0.317(year-1996)^2 + 0.058(year-1996) + 3.516
Regarding fertilizer prices, the problem is not going to occur in North America. A 10x to 50x rise in the constant dollar price of fertilizer over the next 40 years will inevitably have a lot more impact on a densely populated (and still growing) nation with a per capita GDP of $1,000 than on the USA with its relatively stable population and a per capita gdp of $40,000+.
The United States, relatively speaking, is going to have very few problems in the coming years. The same goes for the much of the rest of the OECD. That can emphatically not be said of Africa, South Asia and the oil-free nations of the Middle East.
Paul, as I have said elsewhere, I love your essay; you've created an excellent resource. I'll only pick this nit "...the USA with its relatively stable population..." which you left in the comment above.
The US is the only developed country with a steadily growing population. See here for example. Projections are for as much as 50% growth over the next 40 years. As we gobble up ag land for housing and cities and try to feed all the additional people, I think US agriculture is going to be hard pressed, and the knock-on affect on exports and the people those exports feed is going to be harsh.
I agree, the population of the USA is only "relatively stable" relative to places like India or Indonesia, not to places like France, the UK or Japan.
I've started to wonder if there might be an Export Land Model for food as well as for oil. If there is, American grain exports are one place to look for the effects. That is a scary thought.
The primary problem for US agricultural exports is lack of rain, not home consumption. Ditto in spades for Australia. We did increase our population rapidly by immigration, though.
"Regarding fertilizer prices...A 10x to 50x rise in the constant dollar price of fertilizer over the next 40 years..."
I've only had a brief chance to research electrolysis as a source for hydrogen for fertilizer, but it looks like it would only be 2-3x more expensive than hydrogen from natural gas(NG), so I think perhaps at most a 3x rise is more realistic.
More importantly, perhaps, fertilizer is much easier to transport than NG, so fertilizer production will move to places in the world with cheap stranded NG, of which there is a lot and will be for some decades to come.
Oh ... thx for your effort Paul.
I have to read this once more ,I mean to consume all this. But first I'll have to take my "awareness-pills" !
Joe
Well written article. Two comments; first, If one takes the reference case from "Limits to Growth- The 30 Year Update" and replot the resources curve slope to get production rate and then divide this by the population curve, the result is nearly identical to the right side of your Fig. 16. Secondly, as you mention, there is probably a lot of optimism in several of your projections for energy growth, lets hope the population growth issue can become more visible on the world's radar screen and less of a taboo subject.
Until TPTB fix the busted link in the main article, here is the correct link to the Excel spreadsheet with the raw data:
http://www.paulchefurka.ca/WEAP2/WEAP2_data.xls
The link in the main article is fixed now.
Just a quick point - the nuclear lifecycle is a very long way from being an "energy source that does not generate greenhouse gases". Of course it is true that at present almost no energy source's full lifecycle fails to generate net greenhouse gases, but nuclear really shouldn't be put in the same category as solar, wind and hydro in this regard.
I'd refer you to our Lean Guide to Nuclear Energy, but I have to confess you'll have to wait a week until its launch on the 19th.
Impressive post but one can say that it is a static view of our future. For instance, I think that PV efficiency will likely increase in the future:
In comments that I made to your previous post.
Half of the nuclear reactors in the USA have been extended to 60 year operation already. Japan and USA are looking at longer extensions to 70 and 80 years. So I am not sure why you chose 50 year operation.
There are nuclear power upgrades (5-20%) that are being performed and there is MIT research on 50% power upgrades. So existing reactors can generate more power even when fewer new ones are built.
China's nuclear power build is accelerating. With another 10GW likely to built in the interior by 2020. For a total of 50GW by 2020.
There has been no consideration of the impact of a climate change bill passing. EIA projects that such a bill would triple nuclear and renewables in the USA by 2030.
the Finex steel making process is steel cheaper, cleaner and more efficient.
Finex powerpoint
===========
http://advancednano.blogspot.com
Boosting efficiency is one factor in bringing costs down, but it is not the only one. Evergreen solar, for example has cut material costs quite a bit with their ribbon method of growing panels and Aten solar sells amorphous silicon panels for $3.00/Watt retail by using very little silicon. The lower efficeincy thin films are finding a share of the market also because they use less.
One of the biggest current drivers for reducing cost is scale of production. Going to 500 MW/year over 70 MW/year is about a factor of 4 decrease in cost. This is beginning to happen as it becomes clear that the market will support this scale of production.
Chris
How about fusion?
http://video.google.com/videoplay?docid=1996321846673788606
http://emc2fusion.org/2006-9%20IAC%20Paper.pdf
http://askmar.com/ConferenceNotes/Should%20Google%20Go%20Nuclear.pdf
http://en.wikipedia.org/wiki/Polywell
I'm not the type to get really excited, but I just can't help it when it comes to things like this. This isn't a single inventor trying to make a perpetual motion machine. It's a Standford professor who spent 20 years of his life researching this concept. Give it a read and tell me what you think!
Very interesting and well-done article!
Regarding coal, I am wondering how the declining quality of the coal affects the calculation. Are the projections you are using for coal based on volume of coal mined, or do they reflect the lower BTU content of the later-mined coal? If the projections reflect only volume, i would think this would be a worthwhile adjustment.
That fall in coal quality is probably overestimated. Much of the change was due not to a shortage of high quality coal, or increasing mining costs, but to sulfur regulations, which moved demand for high-sulfur coal from places like Illinois, to western coal.
Yes, it does reflect the lower energy content. I'm using the Energy Watch Group's scenario, and they paid close attention to coal grades when they constructed their curves.
Figures 9 & 13 in this presentation, where total projected production for each type of energy is compared, clearly illustrate the two critical bridge fuels we must focus on over a dangerous 30 year transition period away from oil. Those two bridge fuels are gas and coal in the form of LNG and modern clean coal technologies such as CTL. Those are the only two with the immediate scale, mass, and technological know how to be of any use while the effective oil replacement fuels of the next generation are developed. These two bridge fuels (along with nuclear power plants) have been embraced for many years by most nations around the world, except in the U.S., where they have been fitted with a boogey-man mask and made out to be public enemy #1. This will do a lot to make the U.S. a second rate economic power in the post-peak world.
The Great Fotosynthetic Inversion Cascade, part 01
the awesome dys-synergy of cumulative dead-sunlight
Economic Enery-Ratio Inversion Cascade - bad
Biospheric Enery-Ratio Inversion Cascade - worse
inversion-cascade does exactly what its supposed to do,
mess things up, make things lose structure and cohesion
lower net energy ratios for the functionality
of all organic and synthetic systems and living things
- nice, hot, no fuel, no electric, no food, no ice,
just go away and die
worthless negative net energy-ratio human systems - shame
two simultaneous inversion cascades combined in synergy
- happiness-inversion, nasty rotten dead things,
some humans will survive the economic collapse,
however, the biospheric destabilisation
may not be prevented, even at 100% reduction
of greenhouse emmision it may be too late
for natural equilibrium. and so, without human energy...
the economic enery-ratio inversion cascade
- fluid/electric collapse, transient pulse cannibalism
oil, gas, coal, uranium, foton snares, wind/hydro traps,
kinetic resources, tidal, any other thorium/fusion stuff,
the construction of all alternatives require resources,
dubbleplus dangerously connected with EROI
for existing energy and resource availability
if oil gets to 160 a barrel or closer to 200
before half the required alter-energy work is completed
everything will just fall apart in a few short years
free market systems cannot function logically
in such a cascade, as most profit margins will evaporate,
thus capitalism would be an inferior broken system,
when the markets freeze up, and they surely must,
someone should formulate a communist-style energy-plan
for transportation, logistics concerning food,
electricity and industrial capacity for building
alternatives.
if oil and gas prices reach critical feedback
levels before reconstruction of vital infrastructure
has been completed, all forms of energy and resources
will become somewhat more expensive,
including every viable form of energy alternative,
then industrial societies will collapse in cascading fun.
climate "change" - net EROI ratio for bio-functioning
of many organisms will inevitably drop below critical
levels, temperature gradients, pollution,
habitat-destruction, such symmetry.
the biospheric enery-ratio inversion cascade
- the 6th extinction, proceeding as it rightly should
- possibly maybe lower atmospheric O2 levels in 100 years
atmospheric O2 levels are probably dropping right now,
but maybe only a few ppm a decade for now.
atmospheric O2 levels could begin to rapidly deplete
within 80 years, if the oceans get hit too hard,
terminal O2 decline resulting in uninhabitable atmosphere
in 2200 - 2600 land-animals that havent starved by then
will suffocate at drop from 20,95% O2 to 19% - 18%
effect will be irreversible, due to massive lack
of available energy for required geo-engineering
now maybe 2 or 4 years left for real action
to prevent greater depression, regardless of CO2 levels,
vital infrastructure must be maintained at all costs,
screw the biosphere, what has it done for us lately?
- economic inversion cascade
after that we're mostly screwed due to powerful synergy
of energy crisis and continued biosphere destabilisation
There are some things that might help. Advances in enhanced oil recovery may slow the decline in oil production. a way be discovered to exploit methane hydrates, which would solve all the energy problems.